Monitor
Use the Monitor menus to check Nebula Device event log messages and summary report for Nebula Devices in the selected site.
Event Log
Use this screen to view WiFi Nebula Device log messages. You can enter the Nebula Device name or a key word, select one or multiple event types, or specify a date/time or even a time range to display only the log messages related to it.
Click Site-wide > Monitor > Access points > Event log to access this screen.
Site-wide > Monitor > Access points > Event log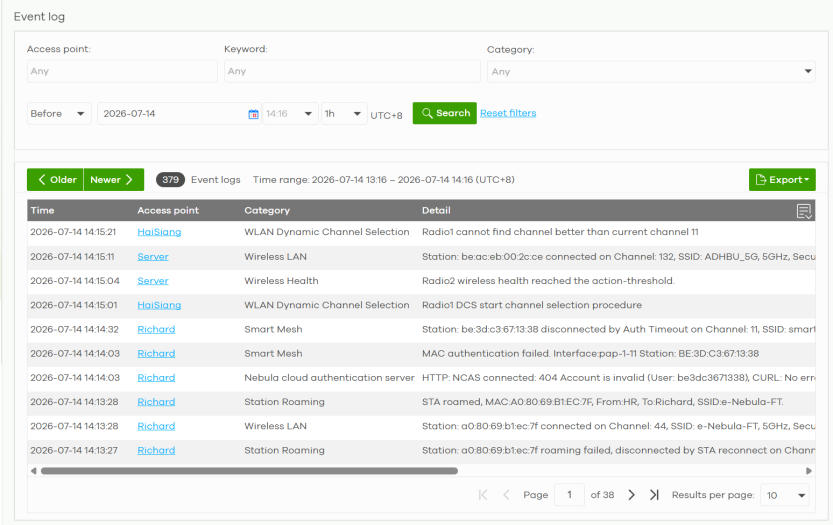
The following table describes the labels in this screen.
Label | Description |
|---|---|
Access point | Select the access point(s) in your site. Otherwise, select Any to display all. |
Keyword | Type a keyword to display logs with this keyword. |
Category | Select the type of log you want to display from this list box. Otherwise, select Any to display events from all categories. 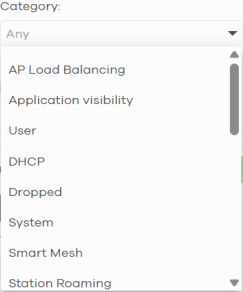 |
Range / Before | Select the filtering options, set a date, and then click Search to filter log entries by date. Range: Display log entries from the first specified date to the second specified date. Before: Display log entries from the beginning of the log to the selected date. |
Search | Click this to update the list of logs based on the search criteria. |
Reset filters | Click this to return the search criteria to the previously saved time setting. |
Older / Newer | Click to view the list of log messages with the most recent or oldest message displayed first. |
matches in | This shows the number of event logs that match your filter criteria after you perform a search. |
Export | Click this button to save the logs as a CSV or XML file to your computer. |
Time | This shows the date and time in UTC+00:00 (or UTC+0) when the log was recorded. UTC is a standard time for use around the world (formerly known as Greenwich Mean Time or GMT). UTC is an international abbreviation that is neither French nor English. It means both "Temps Universel Coordonné" and "Coordinated Universal Time". |
Access point | This shows the Nebula Device model name. |
Tag | This shows the user-specified tag for the Nebula Device. |
Category | This field displays the type of log that generated the log message. It is the same value used in the Category field above. |
Detail | This field displays the reason the log message was generated. |
 | Click this icon to display a greater or lesser number of event log fields. |
Wireless Health
This screen lets you monitor the health of WiFi networks for your Nebula Devices and connected WiFi clients.
You can improve WiFi network performance by doing the following:
• Enable DCS (Dynamic Channel Selection) to select a radio channel with least interference
• Enable client steering to use a stronger WiFi signal
• Change channel bandwidth to reduce radio interference from other WiFi devices
Click Site-wide > Monitor > Access points > Wireless health to access this screen.
Site-wide > Monitor > Access points > Wireless health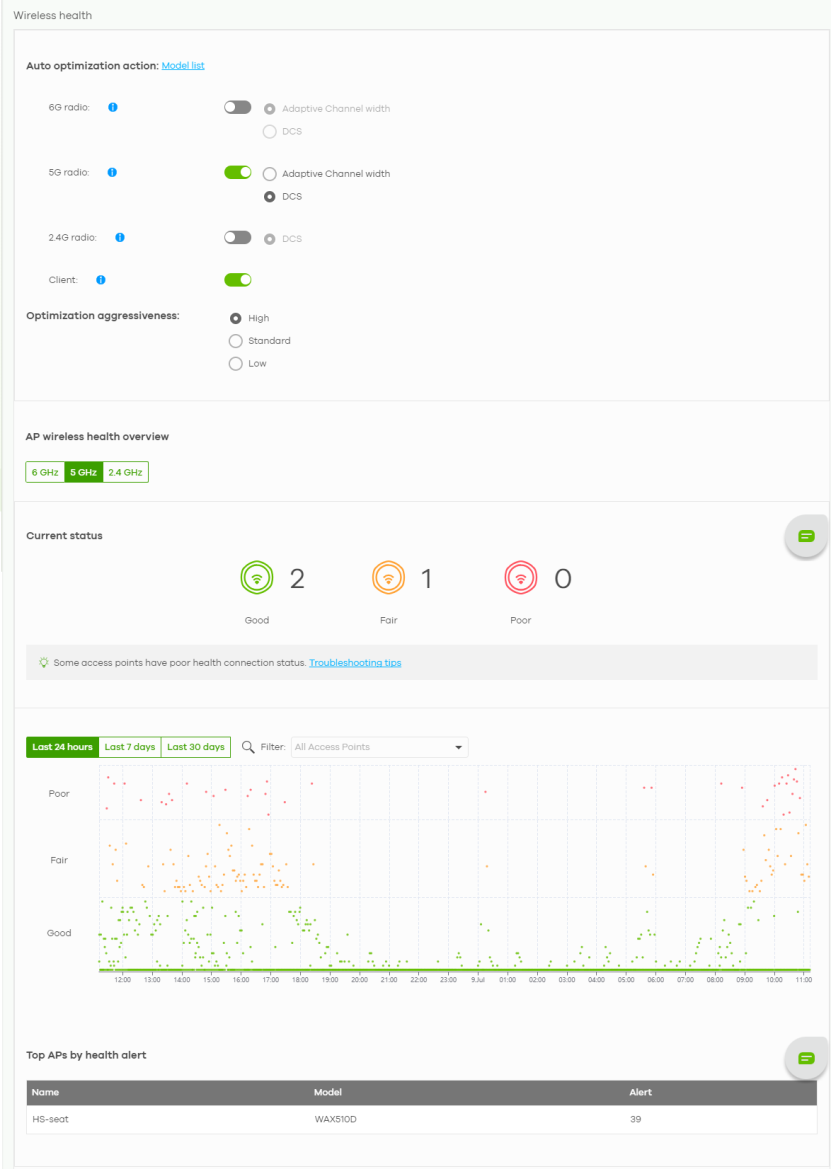
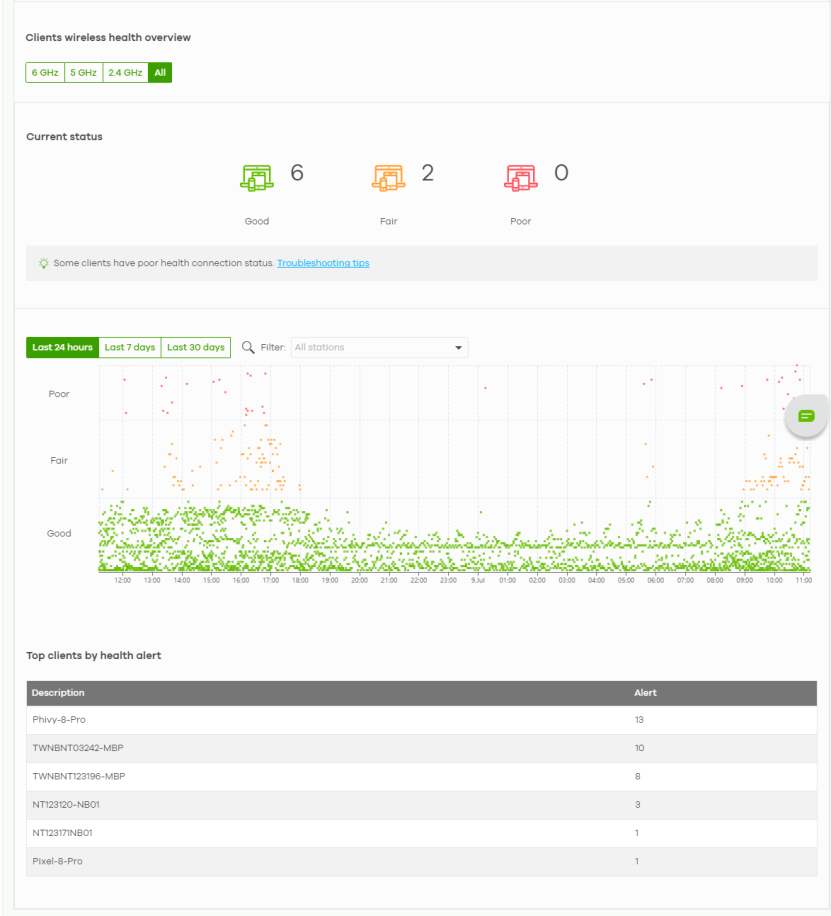
The following table describes the labels in this screen.
Label | Description |
|---|---|
Auto optimization action | |
6 GHz radio | Select ON to enable and specify how the Nebula Device improves the WiFi network performance. Otherwise, select OFF to disable it. • Adaptive channel width – select this option to have the Nebula Device change the channel bandwidth from 160 MHz to 80 MHz to reduce the radio interference with other WiFi devices. If adaptive channel width does not improve WiFi performance then the Nebula Device also performs Dynamic Channel Selection (DCS). • DCS (Dynamic Channel Selection) – select this option to have the Nebula Device scan and choose a radio channel that has least interference. |
5 GHz radio | Select ON to enable and specify how the Nebula Device improves the WiFi network performance. Otherwise, select OFF to disable it. • Adaptive channel width – select this option to have the Nebula Device change the channel bandwidth from 80 MHz to 20 MHz to reduce the radio interference with other WiFi devices. If adaptive channel width does not improve WiFi performance then the Nebula Device also performs Dynamic Channel Selection (DCS). • DCS (Dynamic Channel Selection) – select this option to have the Nebula Device scan and choose a radio channel that has least interference. |
2.4 GHz radio | Select ON to enable the Nebula Device to improve the WiFi network performance. Otherwise, select OFF to disable it. • DCS (Dynamic Channel Selection) – select this option to have the Nebula Device scan and choose a radio channel that has least interference. |
Client | Select ON to have the Nebula Device try to steer the WiFi clients in poor health to a Nebula Device or SSID with a strong signal. Client steering to improve the signal strength is done every 30 minutes. Otherwise, select OFF to disable steering. |
Optimization aggressiveness | The Nebula Device optimizes the WiFi network performance by doing the following:. • Change the channel bandwidth from 160 MHz to 80 MHz, or 80 MHz to 20 MHz to reduce radio interference from other wireless devices (Adaptive Channel Width). • Select a radio channel with least interference (DCS, Dynamic Channel Selection). • Direct clients to an AP with a stronger WiFi signal. There might be some disruption to the client’s WiFi connections while the Nebula Device is optimizing the WiFi network. To minimize disruption, you can decide to optimize the WiFi network only when the WiFi network is below a certain level of busyness. Low, Standard, and High stand for different levels of busyness. The busyness level you select decides when the Nebula Device takes action to optimize the WiFi network. Low: Only perform WiFi network optimization action when the WiFi network traffic is below Low. Standard: Only perform WiFi network optimization action when the WiFi network traffic is Low. High: Only perform WiFi network optimization action when the WiFi network traffic is Standard, or Low. |
AP wireless health overview | |
Current status | This shows the number of supported Nebula Devices that are currently online, using the specified frequency band that are in Good, Fair or Poor wireless health threshold as detected by Nebula. |
y-axis | The y-axis represents the state of wireless health. |
x-axis | The x-axis shows the time period over which the Nebula Device health state is recorded. |
Top APs by health alert | |
Name | This shows the descriptive name of the Nebula Device. |
Model | This shows the model number of the Nebula Device. |
Alert | This shows how many times the Nebula Device is in a poor state of wireless health. The NCC generates a log when the Nebula Device is in poor wireless health. You can view the log messages in the Site-wide > Monitor > Access points > Event log screen. |
Clients wireless health overview | |
Current status | This shows the number of connected WiFi clients that are currently online, using the specified frequency band and in Good, Fair or Poor wireless health threshold as detected by Nebula. |
Client health | Select to view the health of all WiFi clients which are connected to the supported Nebula Devices using the 6 GHz, 5 GHz or 2.4 GHz band. You can select to view the health report for the past day, week or month, as well as filter the WiFi station to view. |
y-axis | The y-axis represents the state of wireless health. |
x-axis | The x-axis shows the time period over which the client health state is recorded. |
Top clients by health alert | |
Description | This shows the descriptive name of the client. |
Alert | This shows how many times the client is in a poor state of wireless health. The NCC generates a log when the client is in poor wireless health. You can view the log messages in the Site-wide > Monitor > Access points > Event log screen. |
Roaming Dashboard
Roaming allows a WiFi client to automatically switch to a nearby access point with a stronger signal while maintaining the WiFi connection. This helps provide uninterrupted network access as you move between coverage areas.
This screen provides an overview of WiFi clients roaming statistics. This helps administrators identify and troubleshoot WiFi clients roaming issues.
Click Site-wide > Monitor > Access points > Roaming dashboard to access this screen.
Site-wide > Monitor > Access points > Roaming dashboard > WiFi roaming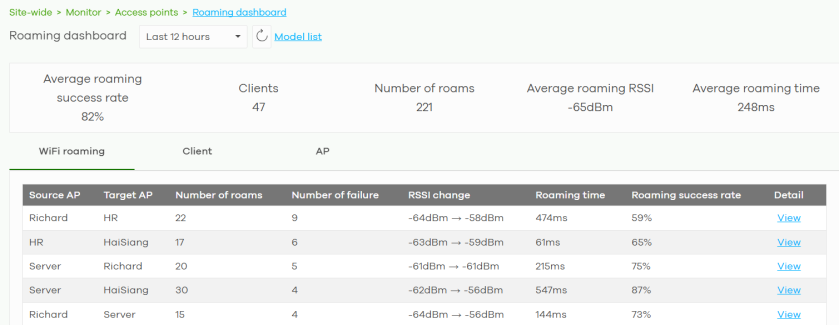
Site-wide > Monitor > Access points > Roaming dashboard > WiFi roaming > View WiFi roaming details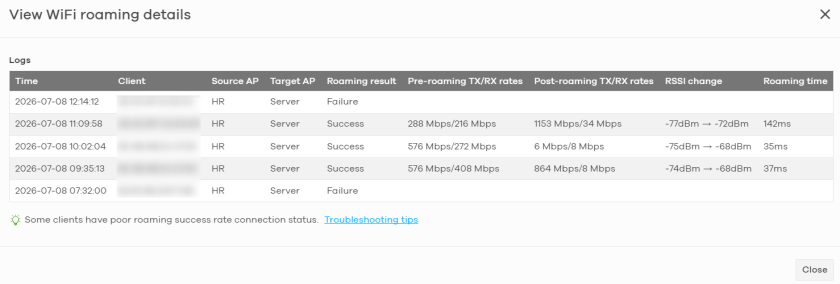
Site-wide > Monitor > Access points > Roaming dashboard > Client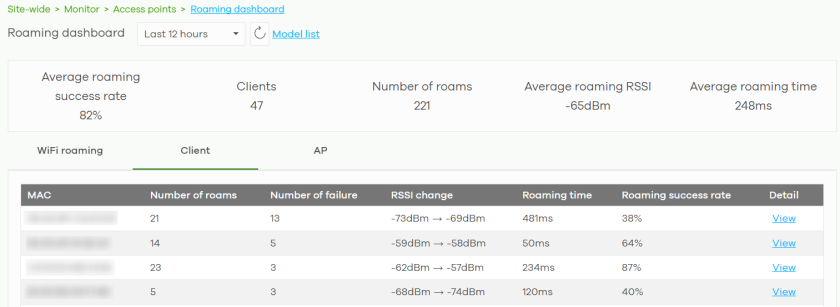
Site-wide > Monitor > Access points > Roaming dashboard > Client > View client details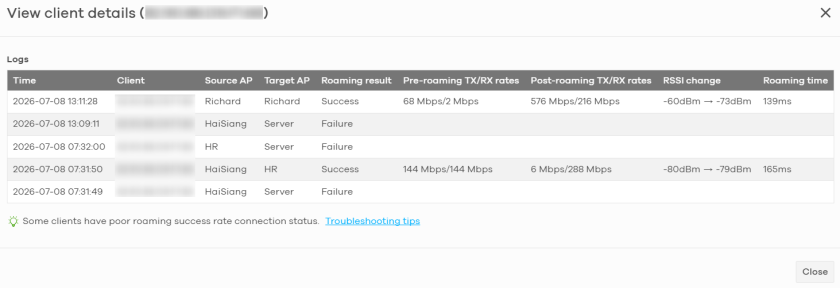
Site-wide > Monitor > Access points > Roaming dashboard > AP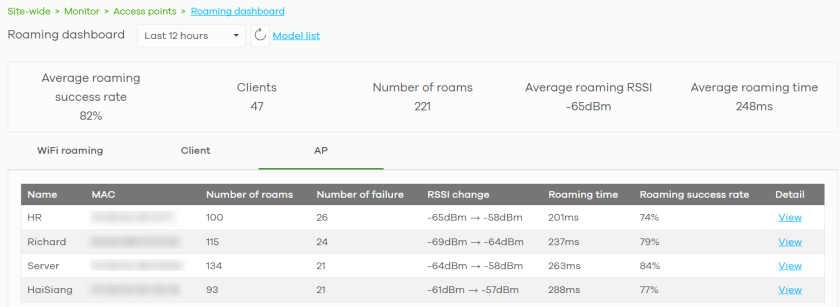
Site-wide > Monitor > Access points > Roaming dashboard > AP > View AP details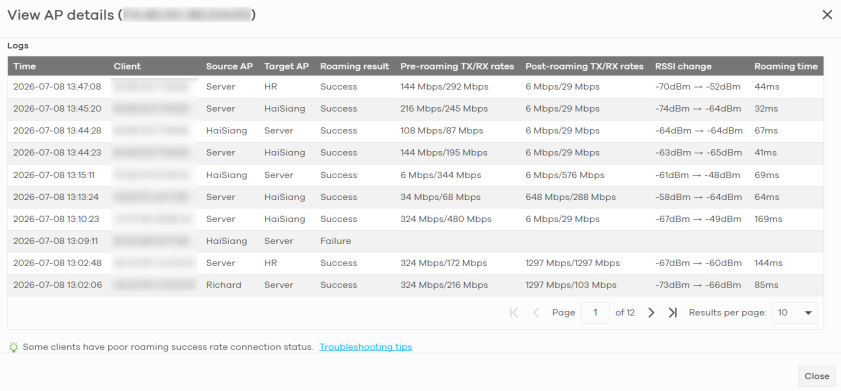
The following table describes the labels in these screens.
Label | Description |
|---|---|
Roaming dashboard | |
Time range | Select a time range and click Update to view the statistics within this time range. |
Average roaming success rate | This shows the average percentage of successful roaming events of all Nebula Device clients in this site within the selected time range. |
Clients | This shows the number of WiFi clients that roam between APs in this site within the selected time range. |
Number of roams | This shows the number of roaming events within the selected time range. |
Average roaming RSSI | This shows the average Received Signal Strength Indicator (RSSI), in dBm, of all roaming events before a WiFi client roams to another AP. The closer the RSSI value is to 0 dBm, the stronger the signal strength. For example, -50 dBm is a stronger signal than -70 dBm. |
Average roaming time | This shows the average time, in milliseconds (ms), that a WiFi client takes to roam from one AP to another. Lower values indicate smoother roaming performance. |
WiFi roaming | This tab helps administrators identify problematic roaming paths between APs. It shows the roaming statistics between the Source AP (the AP that the client roams from) and the Target AP (the AP that the client roams to). |
Client | This tab helps administrators determine whether the roaming issues are related to specific WiFi clients. It shows the roaming statistics for each WiFi client identified by its MAC address. |
AP | This tab helps administrators identify roaming issues on specific APs, and determine whether their placement needs to be adjusted. It shows the roaming statistics for each AP, identified by its name and MAC address. |
Number of roams | This shows the total number of roaming events based on different grouping methods. • Example 1: Under the WiFi roaming tab, 23 roaming events are recorded from Source AP Richard to Target AP HR. 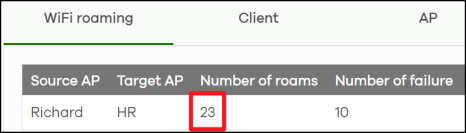 • Example 2: Under the Client tab, 4 roaming events are recorded for this WiFi client (MAC address: 0x:xx:xx:xx:xx:x3). 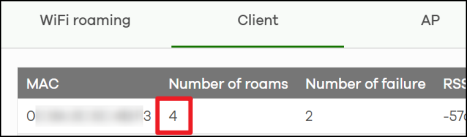 • Example 3: Under the AP tab, 107 roaming events are recorded on the AP named HR (MAC address: Fx:xx:xx:xx:xx:x1). 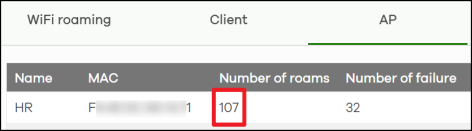 |
Number of failure | This shows the number of times that the roaming fails. |
Roaming success rate | This shows the percentage of successful roaming events. |
Detail | Click View to see detailed information for each entry. |
View WiFi roaming / Client / AP details | |
Time | This shows the date and time when the roaming event occurs. |
Client | This shows the MAC address of the roaming WiFi client. |
Source AP | This shows the AP that the WiFi client roams from. |
Target AP | This shows the AP that the WiFi client roams to. |
Roaming result | This shows Success if the roaming is successful or Failure if the roaming fails. |
Pre-roaming TX/RX rates | This shows the transmit (TX) and receive (RX) data rates before roaming. No data is displayed if the Roaming result is Failure. |
Post-roaming TX/RX rates | This shows the transmit (TX) and receive (RX) data rates after roaming. No data is displayed if the Roaming result is Failure. |
RSSI change | This shows the RSSI values before and after a WiFi client roams to another AP. It allows you to compare the signal strength before and after roaming. The closer the RSSI value is to 0 dBm, the stronger the signal strength. In the following example, the RSSI changes from -73 dBm (before roaming) to -68 dBm (after roaming), an increase of 5 dBm. The signal strength has improved after roaming. 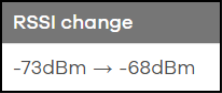 |
Roaming time | This shows the time, in milliseconds (ms), that the WiFi client takes to complete the roaming from Source AP to Target AP. |
Summary Report
This screen displays network statistics for Nebula Devices of the selected site, such as bandwidth usage, top clients and/or top SSIDs.
Click Site-wide > Monitor > Access points > Summary report to access this screen.
Site-wide > Monitor > Access points > Summary report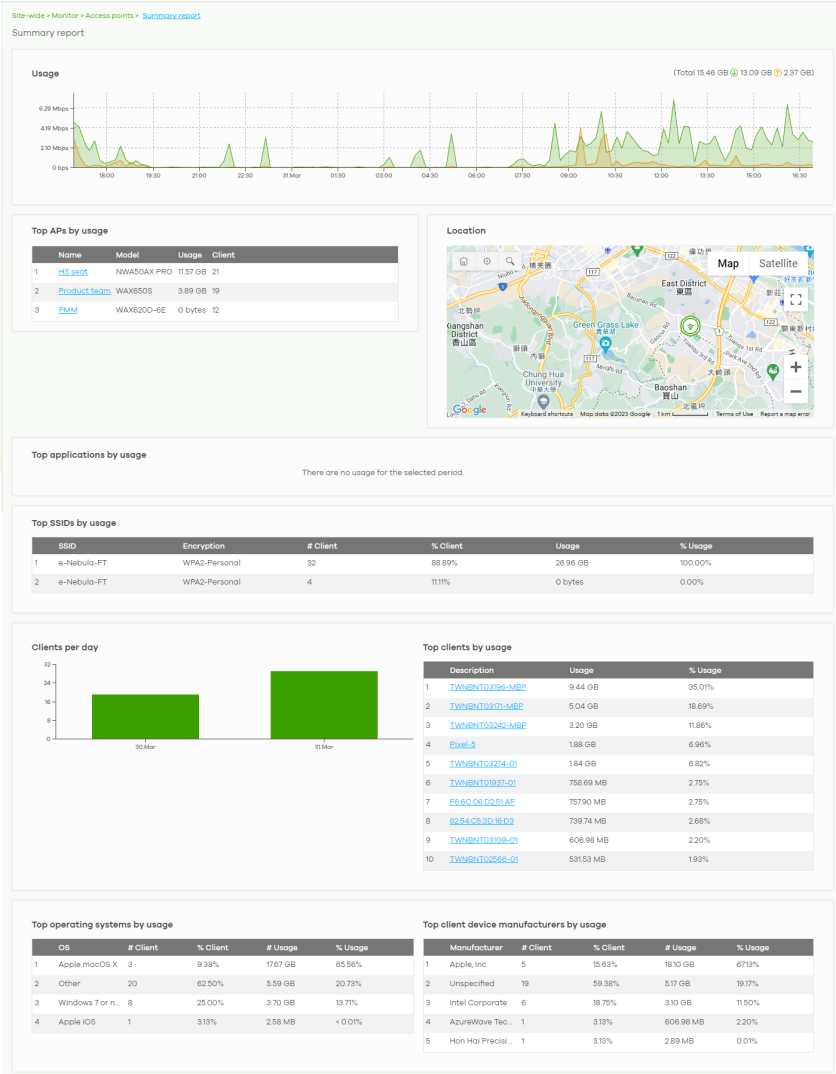
The following table describes the labels in this screen.
Label | Description |
|---|---|
Summary report | |
Time range | Select a time range and click Update to view the statistics within that time range. |
Usage | |
y-axis | The y-axis shows the transmission speed of data sent on this port in megabits per second (Mbps). |
x-axis | The x-axis shows the time period over which the traffic flow occurred. |
Top APs by usage | |
# | This shows the ranking of the Nebula Device. |
Name | This shows the descriptive name of the Nebula Device. |
Model | This shows the model number of the Nebula Device. |
Usage | This shows the amount of data transmitted or received by the Nebula Device. |
Client | This shows how many clients are currently connecting to the Nebula Device. |
Location This shows the location of the Nebula access points on the map. | |
Top applications by usage | |
# | This shows the ranking of the application. |
Application | This shows the application name. |
Category | This shows the category of the application, for example email, file sharing. |
Usage | This shows the amount of data consumed by the application. |
% Usage | This shows the percentage of usage for the application. |
Top SSIDs by usage | |
# | This shows the ranking of the SSID. |
SSID | This shows the SSID network name. |
Encryption | This shows the encryption method used by the SSID network. |
# Client | This shows how many WiFi clients are connecting to this SSID. |
% Client | This shows what percentage of associated WiFi clients are connecting to this SSID. |
Usage | This shows the total amount of data transmitted or received by clients connecting to this SSID. |
% Usage | This shows the percentage of usage for the clients connecting to this SSID. |
Clients per day | |
y-axis | The y-axis represents the number of clients. |
x-axis | The x-axis represents the date. |
Top clients by usage | |
# | This shows the ranking of the client. |
Description | This shows the descriptive name or MAC address of the client. |
Usage | This shows the total amount of data transmitted and received by the client. |
% Usage | This shows the percentage of usage for the client. |
Top operating systems by usage | |
# | This shows the ranking of the operating system. |
OS | This shows the operating system of the client device. |
# Client | This shows how many client devices use this operating system. |
% Client | This shows the percentage of top client devices which use this operating system. |
# Usage | This shows the amount of data consumed by the client device on which this operating system is running. |
% Usage | This shows the percentage of usage for top client devices which use this operating system. |
Top client device manufacturers by usage | |
# | This shows the ranking of the manufacturer. |
Manufacturer | This shows the manufacturer name of the client device. |
# Client | This shows how many client devices are made by the manufacturer. |
% Client | This shows the percentage of top client devices which are made by the manufacturer. |
# Usage | This shows the amount of data consumed by the client device. |
% Usage | This shows the percentage of usage for the client device. |