Firewall
Overview
This chapter describes the menus used to monitor and configure the Hybrid Security Firewall devices that acts as a security gateway in the current organization.
Nebula Device (also called Security Firewall device) refers to ZyWALL ATP / USG FLEX / USG FLEX H / USG20(W)-VPN Series devices in this chapter. The Firewall menus are shown for Security Firewall devices only.
Monitor
Use the Monitor menus to check the Nebula Device information, client information, event log messages and summary report for the Nebula Device in the selected site.
Clients
This menu item redirects to Site-wide > Monitor > Clients, with type set to Security firewall clients. For details, see Clients.
Event Log
Use this screen to view Nebula Device log messages. You can enter a key word, select one or multiple event types, or specify a date/time or a time range to display only the log messages that match these criteria.
Select Range to set a time range or select Before to choose a specific date/time and the number of hours/minutes to display only the log messages generated within a certain period of time (before the specified date/time). Then click Search to update the list of logs based on the search criteria. The maximum allowable time range is 30 days.
Click Site-wide > Monitor > Firewall > Event log to access this screen.
Site-wide > Monitor > Firewall > Event log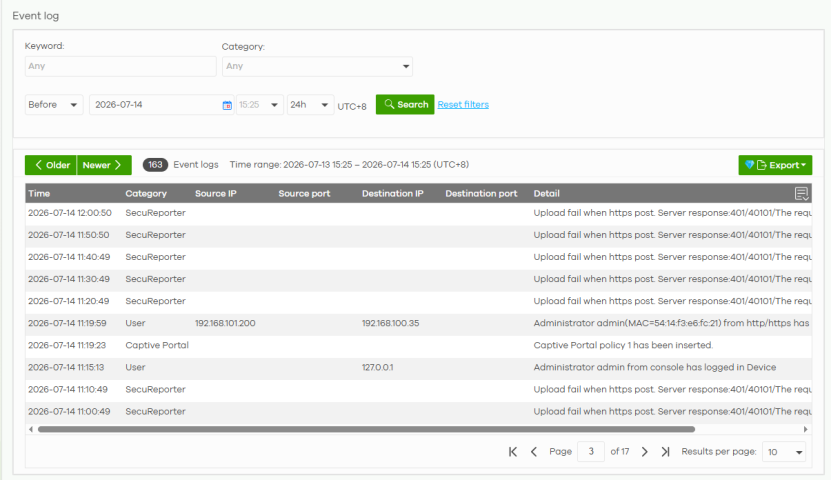
The following table describes the labels in this screen.
Label | Description |
|---|---|
Keyword | Type a keyword to display logs with this keyword. |
Category | Select the type of log you want to display from this list box. Otherwise, select Any to display events from all categories. 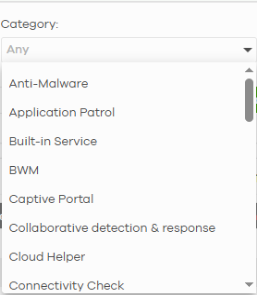 |
Range / Before | Select the filtering options, set a date, and then click Search to filter log entries by date. Range: Display log entries from the first specified date to the second specified date. Before: Display log entries from the beginning of the log to the selected date. |
Search | Click this to update the list of logs based on the search criteria. |
Reset filters | Click this to return the search criteria to the previously saved time setting. |
Older / Newer | Click to view the list of log messages with the most recent or oldest message displayed first. |
matches in | This shows the number of event logs that match your filter criteria after you perform a search. |
Export | Click this button to save the logs as a CSV or XML file to your computer. |
Time | This shows the date and time in UTC+00:00 (or UTC+0) when the log was recorded. UTC is a standard time for use around the world (formerly known as Greenwich Mean Time or GMT). UTC is an international abbreviation that is neither French nor English. It means both "Temps Universel Coordonné" and "Coordinated Universal Time". |
Category | This field displays the type of log that generated the log message. It is the same value used in the Category field above. |
Source IP | This field displays the source IP address in the event that generated the log message. |
Source port | This field displays the source port number in the event that generated the log message. |
Destination IP | This field displays the destination IP address of the event that generated the log message. |
Destination port | This field displays the destination port number of the event that generated the log message. |
Detail | This field displays the reason the log message was generated. |
 | Click this icon to display a greater or lesser number of event log fields. |
VPN Connections
Use this screen to view the status of site-to-site IPSec VPN connections and L2TP VPN connections.
 If the peer gateway is not a Nebula Device, go to the Firewall > Configure > Site-to-Site VPN screen to view and configure a VPN rule. See Site-to-Site VPN for more information.
Click Site-wide > Monitor > Firewall > VPN connections to access this screen.
Site-wide > Monitor > Firewall > VPN connections 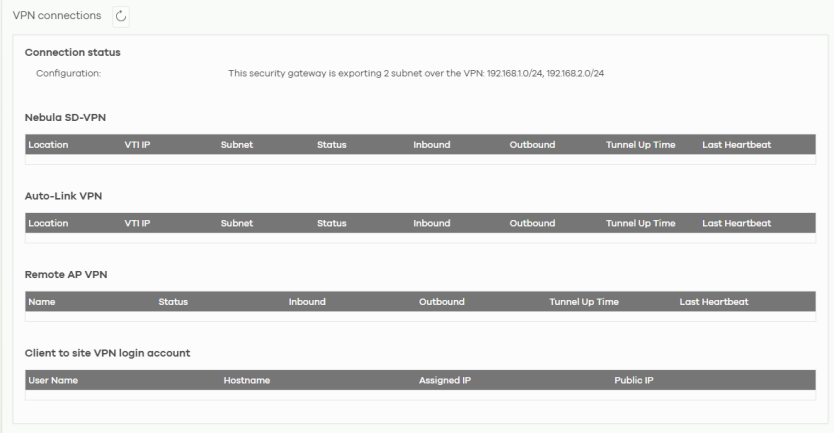
Site-wide > Monitor > Firewall > VPN connections (FLEX H Series only) 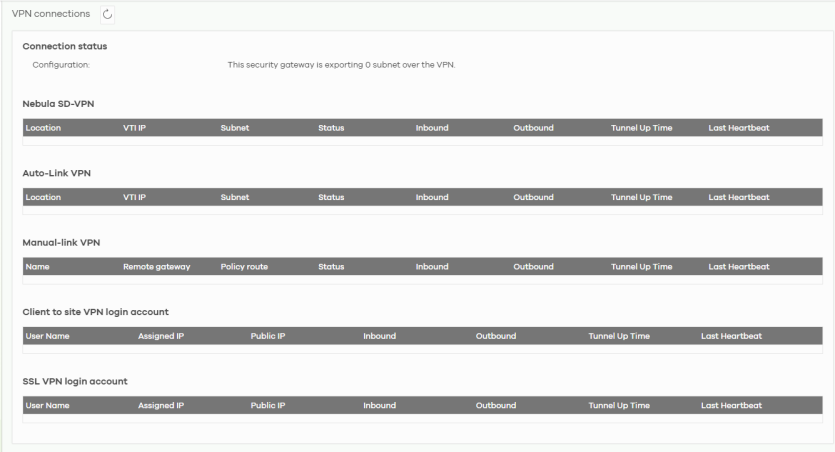
The following table describes the labels in this screen.
Label | Description |
|---|---|
 | Click this button to reload the data on this page. |
Connection status | |
Configuration | This shows the number and address of the local networks behind the Nebula Device, on which the computers are allowed to use the VPN tunnel. |
Nebula SD-VPN | |
Location | This shows the name of the site to which the Nebula peer gateway is assigned. Click the name to view the VPN usage and connectivity status screen. |
VTI IP | This shows the IP address for this connection. IPSec VPN Tunnel Interface (VTI) encrypts or decrypts IPv4 traffic from or to the interface according to the IP routing table. |
Subnet | This shows the address of the local networks behind the Nebula peer gateway. |
Status | This shows whether the VPN tunnel is connected or disconnected. |
Inbound | This shows the amount of traffic through the VPN tunnel between 2 Nebula Devices on different sites since the VPN tunnel was established. |
Outbound | This shows the amount of traffic through the VPN tunnel between 2 Nebula Devices on different sites since the VPN tunnel was established. |
Tunnel up time | This shows how many seconds the VPN tunnel has been active. |
Last heartbeat | This shows the last date and time a heartbeat packet is sent to determine if the VPN tunnel is up or down. |
Auto-Link VPN | |
Location | This shows the name of the site to which the Non-Nebula peer gateway (Zyxel or non-Zyxel IPSec VPN gateway and Cloud VPN (Azure VPN or AWS VPN)) is assigned. Click the name to go to the Site-wide > Configure > Firewall > Site-to-Site VPN screen, where you can modify the VPN settings. |
VTI IP | This shows the IP address for this connection. IPSec VPN Tunnel Interface (VTI) encrypts or decrypts IPv4 traffic from or to the interface according to the IP routing table. |
Subnet | This shows the address of the local networks behind the Non-Nebula peer gateway. |
Status | This shows whether the VPN tunnel is connected or disconnected. |
Inbound | This shows the amount of traffic that has gone through the VPN tunnel from the Non-Nebula peer gateway to the Nebula Device since the VPN tunnel was established. |
Outbound | This shows the amount of traffic that has gone through the VPN tunnel from the Nebula Device to the Non-Nebula peer gateway since the VPN tunnel was established. |
Tunnel up time | This shows how many seconds the VPN tunnel has been active. |
Last heartbeat | This shows the last date and time a heartbeat packet was sent to determine if the VPN tunnel is up or down. |
Remote AP VPN (not available for FLEX H Series) | |
Name | This shows the name of the remote access point (AP). |
Status | This shows whether the VPN tunnel is connected or disconnected. |
Inbound | This shows the amount of traffic that has gone through the VPN tunnel from the remote AP to the Nebula Device since the VPN tunnel was established. |
Outbound | This shows the amount of traffic that has gone through the VPN tunnel from the Nebula Device to the remote AP since the VPN tunnel was established. |
Tunnel up time | This shows how many seconds the VPN tunnel has been active. |
Last heartbeat | This shows the last date and time a heartbeat packet is sent to determine if the VPN tunnel is up or down. |
Manual-link VPN (FLEX H Series only) | |
Name | This shows the name of the VPN tunnel. |
Remote gateway | This shows the IP address of the remote gateway. |
Policy route | This field displays the content of the local and remote policies for this IPSec SA. The IP addresses, not the address objects, are displayed. |
Status | This shows whether the VPN tunnel is connected or disconnected. |
Inbound | This shows the amount of traffic that has gone through the VPN tunnel from the remote device to the Nebula Device since the VPN tunnel was established. |
Outbound | This shows the amount of traffic that has gone through the VPN tunnel from the Nebula Device to the remote device since the VPN tunnel was established. |
Tunnel up time | This shows how many seconds the VPN tunnel has been active. |
Last heartbeat | This shows the last date and time a heartbeat packet is sent to determine if the VPN tunnel is up or down. |
Client to site VPN login account | |
User Name | This shows the remote user’s login account name. |
Hostname | This shows the name of the computer that has this L2TP VPN connection with the Nebula Device. |
Assigned IP | This shows the IP address that the Nebula Device assigned for the remote user’s computer to use within the L2TP VPN tunnel. |
Public IP | This shows the public IP address that the remote user is using to connect to the Internet. |
(The following fields are for FLEX H Series only) | |
Inbound | This shows the amount of traffic that has gone through the VPN tunnel from the remote client to the Nebula Device since the VPN tunnel was established. |
Outbound | This shows the amount of traffic that has gone through the VPN tunnel from the Nebula Device to the remote client since the VPN tunnel was established. |
Tunnel up time | This shows how many seconds the VPN tunnel has been active. |
Last heartbeat | This shows the last date and time a heartbeat packet is sent to determine if the VPN tunnel is up or down. |
SSL VPN login account | |
User Name | This shows the remote user’s login account name. |
Assigned IP | This shows the IP address that the Nebula Device assigned for the remote user’s computer to use within the L2TP VPN tunnel. |
Public IP | This shows the public IP address that the remote user is using to connect to the Internet. |
Inbound | This shows the amount of traffic that has gone through the VPN tunnel from the remote client to the Nebula Device since the VPN tunnel was established. |
Outbound | This shows the amount of traffic that has gone through the VPN tunnel from the Nebula Device to the remote client since the VPN tunnel was established. |
Tunnel up time | This shows how many seconds the VPN tunnel has been active. |
Last heartbeat | This shows the last date and time a heartbeat packet is sent to determine if the VPN tunnel is up or down. |
SecuReporter
Click Site-wide > Monitor > Firewall > SecuReporter to open SecuReporter for the current organization and site. SecuReporter allows you to view statistics for the following Nebula Security Services (NSS): Content filter, application patrol, DNS/URL Threat filter, IP Reputation, Anti-Malware, Sandboxing, and Intrusion Prevention System (IPS).
For more details, see the SecuReporter User’s Guide.Site-wide > Monitor > Firewall > SecuReporter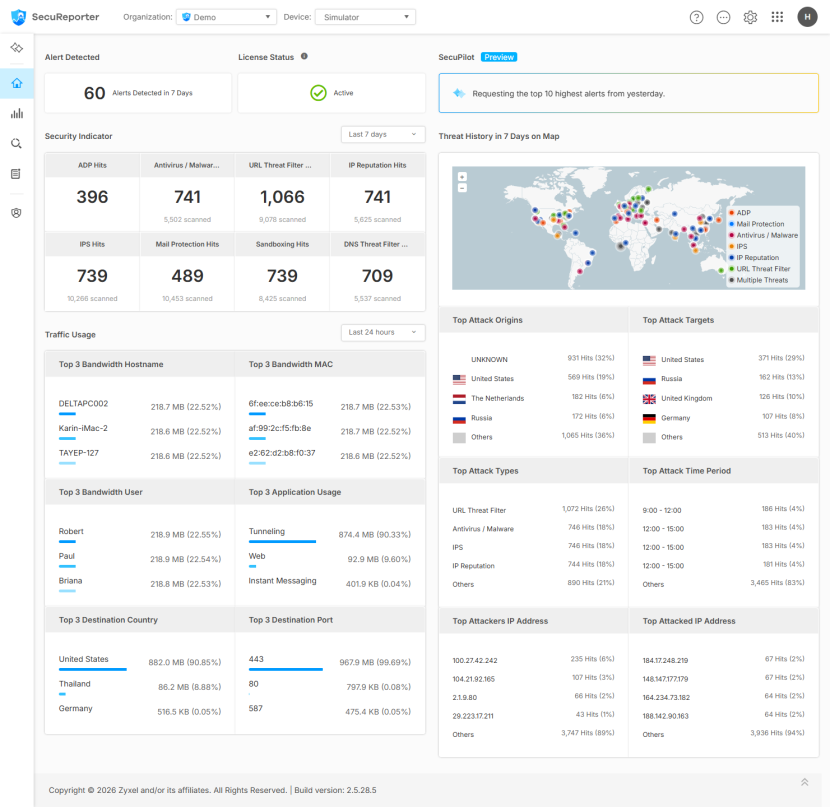
Summary Report
This screen displays network statistics for the Nebula Device of the selected site, such as WAN usage, top applications and/or top clients.
Click Site-wide > Monitor > Firewall > Summary report to access this screen.
Site wide > Monitor > Firewall > Summary report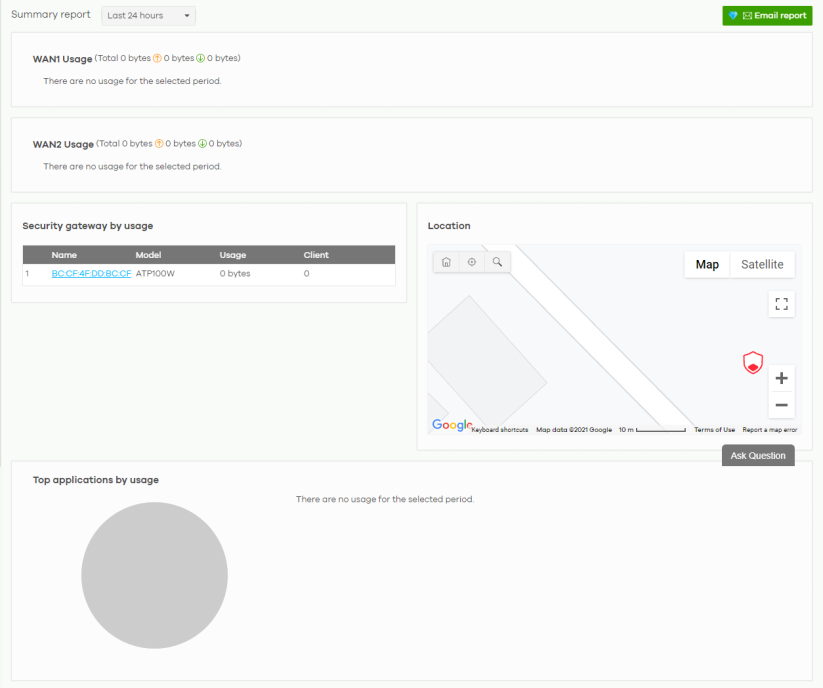
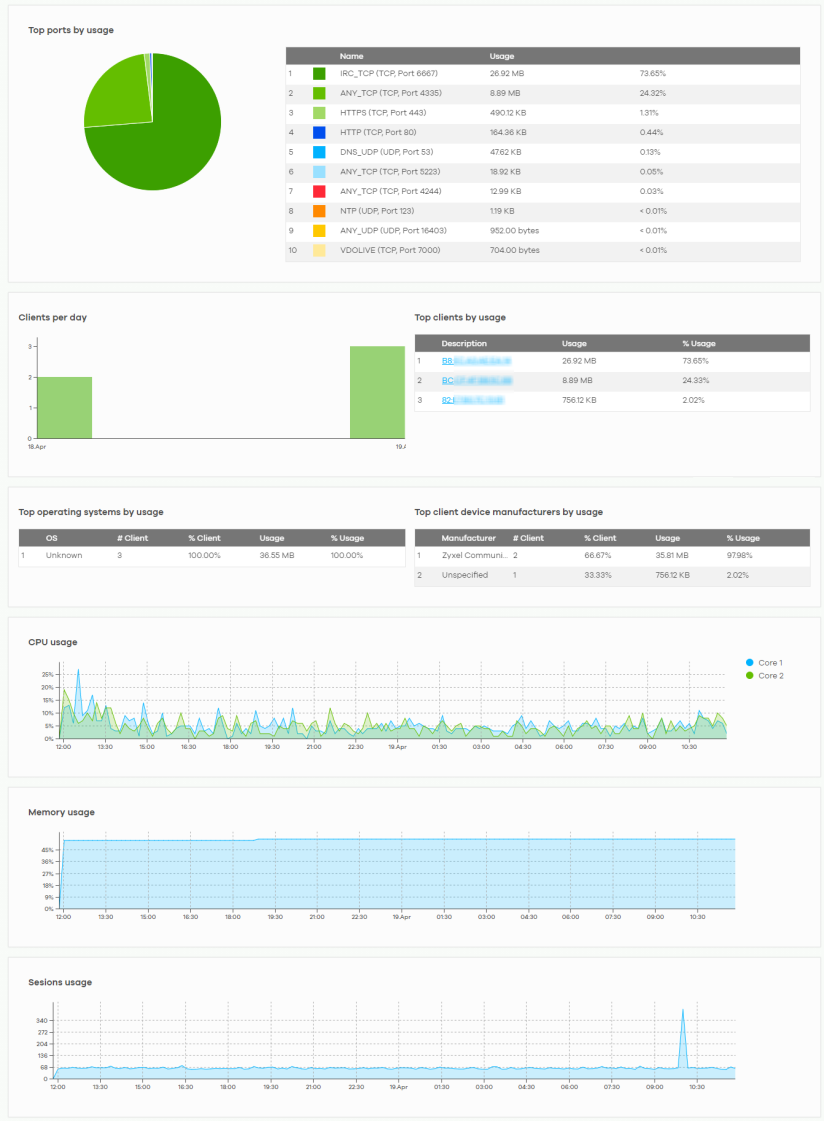
The following table describes the labels in this screen.
Label | Description |
|---|---|
Security gateway – Summary report | Select to view the report for the past day, week or month. Alternatively, select Custom range... to specify a time period the report will span. You can also select the number of results you want to view in a table. 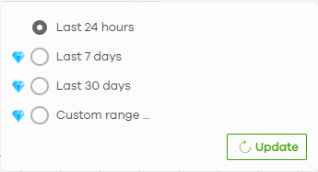 |
Email report | Click this button to send summary reports by email, change the logo and set email schedules. |
WAN usage | |
y-axis | The y-axis shows the transmission speed of data sent or received through the WAN connection in kilobits per second (Kbps). |
x-axis | The x-axis shows the time period over which the traffic flow occurred. |
VPN usage | |
y-axis | The y-axis shows the transmission speed of data sent or received through the VPN tunnel in kilobits per second (Kbps). |
x-axis | The x-axis shows the time period over which the traffic flow occurred. |
Nebula VPN usage | |
y-axis | The y-axis shows the transmission speed of data sent or received through the VPN tunnels, in kilobits per second (Kbps). |
x-axis | The x-axis shows the time period over which the traffic flow occurred. |
Non-Nebula VPN usage | |
y-axis | The y-axis shows the transmission speed of data sent or received through VPN tunnels, in kilobits per second (Kbps). |
x-axis | The x-axis shows the time period over which the traffic flow occurred. |
Remote AP VPN usage | |
y-axis | The y-axis shows the transmission speed of data sent or received through the VPN tunnel between the Nebula Device and remote APs, in kilobits per second (Kbps). |
x-axis | The x-axis shows the time period over which the traffic flow occurred. |
Security gateway by usage | |
This shows the index number of the Nebula Device. | |
Name | This shows the descriptive name of the Nebula Device. |
Model | This shows the model number of the Nebula Device. |
Usage | This shows the amount of data that has been transmitted through the Nebula Device’s WAN port. |
Client | This shows the number of clients currently connected to the Nebula Device. |
Location This shows the location of the Nebula Devices on the map. | |
Top applications by usage | |
This shows the index number of the application. | |
Application | This shows the application name. |
Category | This shows the name of the category to which the application belongs. |
Usage | This shows the amount of data consumed by the application. |
% Usage | This shows the percentage of usage for the application. |
Top ports by usage | |
This shows the top ten applications/services and the ports that identify a service. | |
Name | This shows the service name and the associated port numbers. |
Usage | This shows the amount of data consumed by the service. |
% Usage | This shows the percentage of usage for the service. |
Clients per day | |
y-axis | The y-axis represents the number of clients. |
x-axis | The x-axis represents the date. |
Top clients by usage | |
This shows the index number of the client. | |
Description | This shows the descriptive name or MAC address of the client. |
Usage | This shows the total amount of data transmitted and received by the client. |
% Usage | This shows the percentage of usage for the client. |
Top operating systems by usage | |
This shows the index number of the operating system. | |
OS | This shows the operating system of the client device. |
# Client | This shows how many client devices use this operating system. |
% Client | This shows the percentage of top client devices which use this operating system. |
% Usage | This shows the percentage of usage for top client devices which use this operating system. |
Top client device manufacturers by usage | |
This shows the index number of the client device. | |
Manufacturer | This shows the manufacturer name of the client device. |
Client | This shows how many client devices are made by the manufacturer. |
% Client | This shows the percentage of top client devices which are made by the manufacturer. |
Usage | This shows the total amount of data transmitted and received by the client device. |
% Usage | This shows the percentage of usage for the client device. |
CPU usage | |
y-axis | The y-axis shows what percentage of the Nebula Device’s processing capability is currently being used. |
x-axis | The x-axis shows the time period over which the traffic flow occurred. |
Memory usage | |
y-axis | The y-axis shows what percentage of the Nebula Device’s RAM is currently being used. |
x-axis | The x-axis shows the time period over which the traffic flow occurred. |
Sessions usage | |
y-axis | The y-axis shows how many sessions, both established and non-established, that were create from, to, or within the Nebula Device, or passed through the Nebula Device. |
x-axis | The x-axis shows the time period over which the traffic flow occurred. |