Client Device Heartbeat
Use the Site-wide > Devices > Broadband router > Client device heartbeat screen to monitor the network status of LAN client devices connected to the Nebula Broadband Router, such as NAS server, printer, or IP camera.
Site-wide > Devices > Broadband router > Client device heartbeat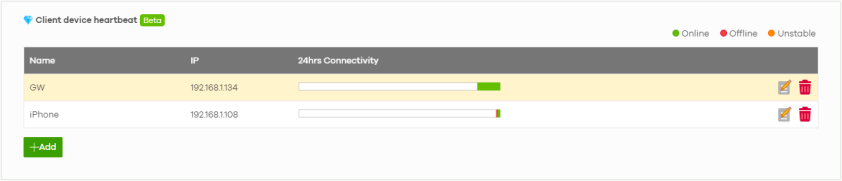
The following table describes the labels in this screen.
Label | Description |
|---|---|
Client device heartbeat | |
Name | This shows the name of the client device to monitor. |
IP | This shows the local (LAN) IP address of the client device connected to the Nebula Broadband Router. |
24hrs Connectivity | This shows the status over the past 24 hours between the Nebula Broadband Router and client device, beginning when the client device was added to the list. Hover the mouse over a colored bar to display the monitored time range. The Nebula Broadband Router monitors the link by sending 3 queries in intervals. The Nebula Broadband Router then uses the reply to know if the link is up and the transmission quality of the link. • Green (online): This shows green when the Nebula Broadband Router is able to get 3 replies to the 3 queries from the client device. • Orange (unstable): This shows orange when the Nebula Broadband Router is able to get 1 or 2 replies to the 3 queries from the client device. • Red (offline): This shows red when the Nebula Broadband Router got no reply from the monitored client device. • White (no connection between the Nebula Broadband Router and the client device). This shows white when: Before adding the client device to monitor to the list, or There is no link between the Nebula Broadband Router and NCC, and you reboot the client device, or The Nebula Broadband Router license has expired, or The client device was removed from the list and added back within 24 hours. |
 | Click the edit icon to change the name of the client device, then click Save. |
 | Click the remove icon to remove the client device from monitoring, then click Save. |
+Add | Click this button to add up to 5 client devices for monitoring. 1. Enter a descriptive name, 1 – 64 characters including 0–9 a–z A–Z `~!@#$%&*(_+-={}|[];'"./<> ?) in the Name field. 2. Enter the IPv4 address of the client device to monitor in the IP field. 3. Then click Save. |