Full Settings Mode
Overview
If your Leaf Plus is managed by NCC, use the local GUI Full Settings Mode for troubleshooting only if your Leaf Plus cannot connect to the Internet. Check the Cloud Control Status on the dashboard for the Internet and NCC connection.
You can access the following screens through the local GUI Full Settings Mode:
• Dashboard
• Maintenance > File Manager > Firmware Package
• Maintenance > File Manager > Shell Script
• Maintenance > Legal and Regulatory > Legal and Regulatory
• Maintenance > Diagnostics > Diagnostics
• Maintenance > Diagnostics > Remote Capture
• Maintenance > Log > View Log
• Maintenance > Reboot > Reboot
Accessing the Full Settings Mode
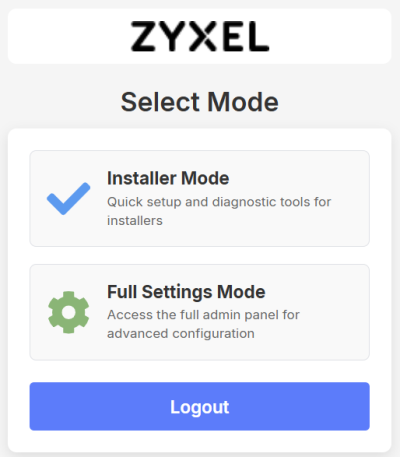
After logging in to the local GUI, select Full Settings Mode. For more information on accessing the local GUI, see Accessing the Local GUI.
 Full Settings Mode is intended for troubleshooting purposes. If your Leaf Plus is registered with NCC, use NCC for complete configuration.
Navigating Full Settings Mode
The following sections introduce the menus and screens in the Leaf Plus’s Full Settings Mode.
Title Bar
The title bar provides some useful links that always appear over the screens below, regardless of how deep into the local GUI you navigate.
Title Bar
The icons provide the following functions.
Label | Description |
|---|---|
Help | Click this to open the help page for the current screen. |
Community | Click this to log into the Zyxel forum to post questions, contribute to a discussion and get feedback on Leaf Plus. |
Logout | Click this to log out of the local GUI. |
nebula | Click this to open the NCC web site login page in a new tab or window. |
Navigation Panel
Use the navigation panel on the left to open screens to configure Leaf Plus features. Click the arrow in the middle of the right edge of the navigation panel to hide the navigation panel menus or drag it to resize them.
Navigation Panel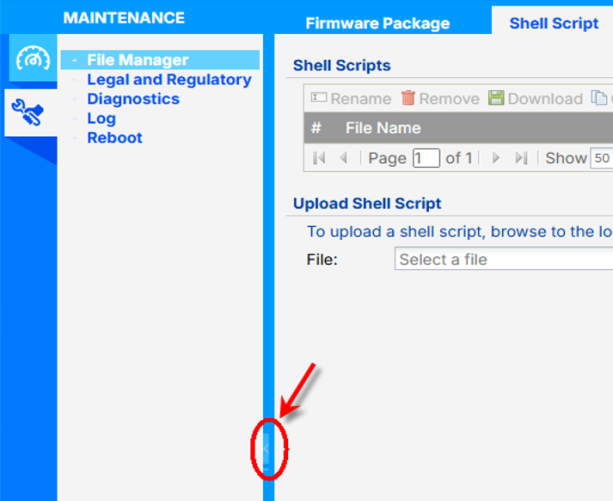
label | description |
|---|---|
Dashboard | Displays general device information. |
Maintenance | Configure firmware files, run diagnostics, and reboot the device. |
Dashboard
The dashboard displays information such as general device information, system status, Leaf Plus registration on NCC, and cloud control status in widgets that you can rearrange to suit your needs.
Local GUI’s Dashboard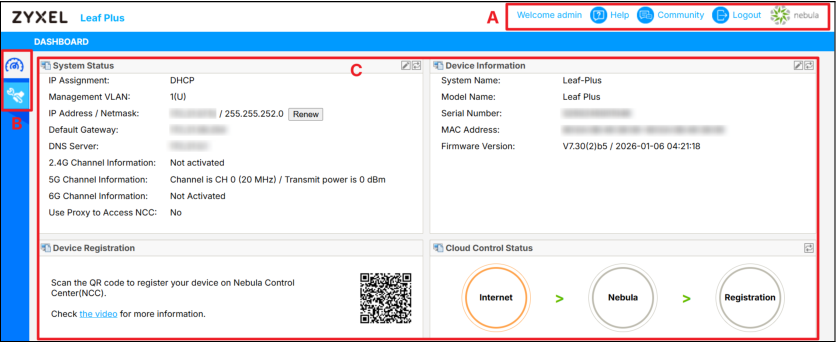
The local GUI’s main screen is divided into these parts:
• A – Title Bar
• B – Navigation Panel
• C – Main Window
Maintenance
Use the maintenance menu screens to manage configuration and firmware files, run diagnostics, and reboot the Leaf Plus.
Folder or Link | Tab | Function |
|---|---|---|
File Manager | Firmware Package | View the current firmware version and to upload firmware. |
File Manager | Shell Script | Manage and run shell script files for the Leaf Plus. |
Legal and Regulatory | Legal and Regulatory | View the legal and regulatory information of the Leaf Plus. |
Diagnostics | Diagnostics | Collect diagnostic information. |
Diagnostics | Remote Capture | Capture network traffic going through the Leaf Plus and output the captured packets to an analyzer. |
Log | View Log | Display log entries for the Leaf Plus. |
Reboot | Reboot | Restart the Leaf Plus. |
Manipulating Table Display
The local GUI tables and lists are quite flexible and provide several options for how to display their entries.
Here are some of the ways you can manipulate the local GUI tables.
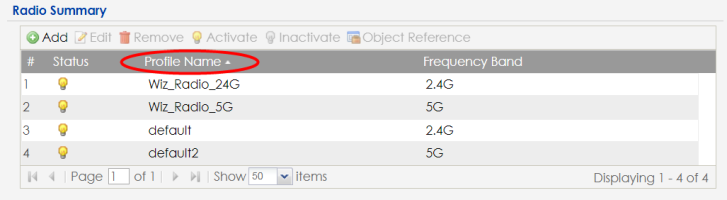
1 Click a column heading to sort the table’s entries according to that column’s criteria.
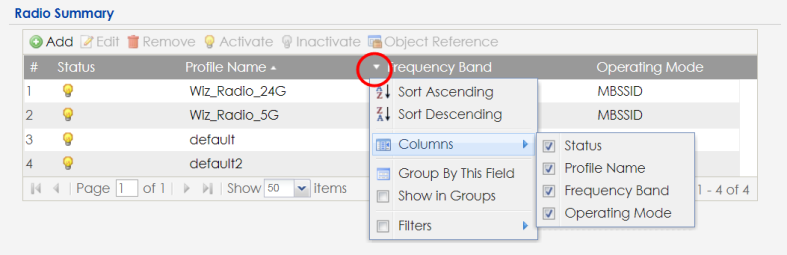
2 Click the down arrow next to a column heading for more options about how to display the entries. The options available vary depending on the type of fields in the column. Here are some examples of what you can do:
• Sort in ascending alphabetical order
• Sort in descending (reverse) alphabetical order
• Select which columns to display
• Group entries by field
• Show entries in groups
• Filter by mathematical operators (<, >, or =) or searching for text.
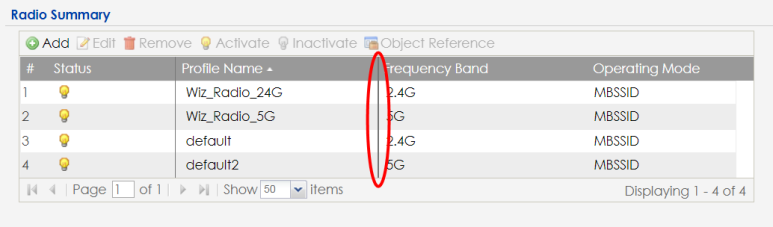
3 Select a column heading cell’s right border and drag to re-size the column.
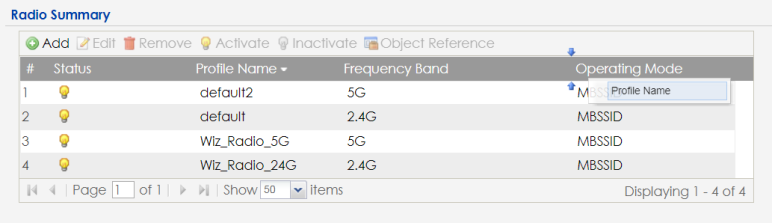
4 Select a column heading and drag and drop it to change the column order. A green check mark displays next to the column’s title when you drag the column to a valid new location.
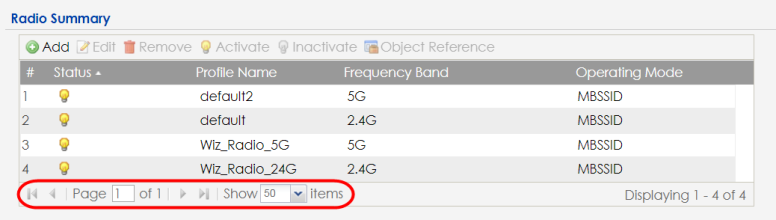
5 Use the icons and fields at the bottom of the table to navigate to different pages of entries and control how many entries display at a time.