Site-wide
Dashboard
If a site is created and selected, the Dashboard is always the first menu you see when you log into the NCC. You can also click Site-wide > Dashboard to access this screen.
It shows the status and information for all types of Nebula Devices connected to the selected site by default.
Click Customize to show the Widget, Reset and Close buttons. You can then rearrange widgets by selecting a block and holding it to move around. You can also click the Widget button to collapse, add and close individual widgets. Click Reset to return the widget settings to the defaults.
Site-wide > Dashboard 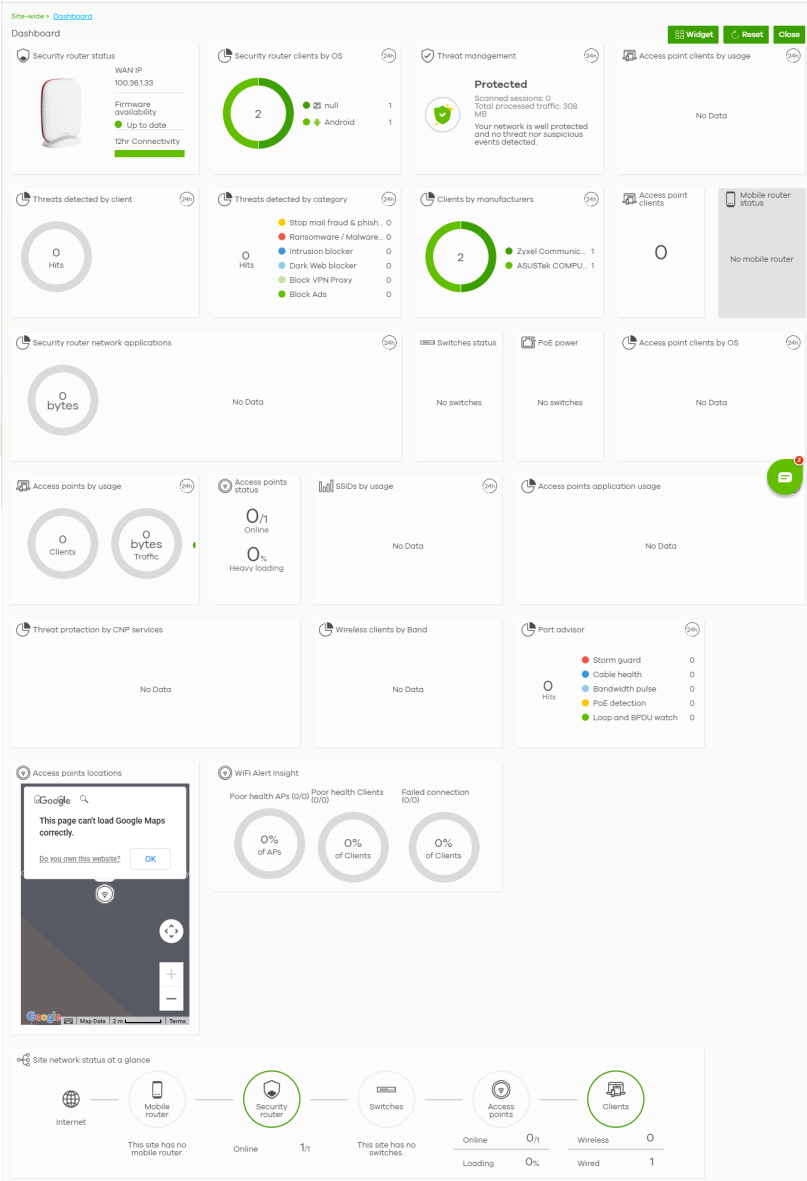
The following table describes the labels in this screen.
Label | Description |
|---|---|
Site network status at a glance | This shows the following: • The number of Nebula mobile routers assigned and connected. • The number of Nebula Security Appliances assigned and connected, and what percentage of the Security Appliance’s processing capability is currently being used if the CPU goes over 93% usage. You can click the Online or CPU value to go to the Site-wide > Devices > Firewall screen and view the detailed information about the Nebula Device. • The number of Nebula Switches assigned and connected, and what percentage of the Switches become overloaded, that is, the number of online Nebula Switches that exceed 70% of their upstream bandwidth by total number of online Nebula Switches in the site. • The number of assigned and connected Nebula access points, and what percentage of the access points become overloaded, that is, the number of online access points that exceed the maximum client device number by total number of online access points in the site. • The number of WiFi / Wired clients currently connected to the managed access points. Depending on your choice of either Security Router or Security Appliance in a site, the corresponding data will be provided on the Dashboard. See the below examples.  |
Access point clients by usage | This shows the top five WiFi clients (clients of the access points only) with the highest percentage of bandwidth usage in the past 24 hours. You can click a client’s name to go to the Site-wide > Clients: Client list screen. |
Access point clients by OS | This shows the top five operating systems used by WiFi client devices in the past 24 hours. You can click an operating system to go to the Site-wide > Clients screen and view the client devices that use this operating system. |
Access point clients | This shows the number of WiFi clients connected (clients of the access points only). |
Clients by manufacturers | This shows the top five manufacturers of WiFi client devices in the past 24 hours. You can click a manufacturer name to go to the Site-wide > Clients screen and view the client devices which are made by the manufacturer. |
Wireless clients by band | This shows the total number of access points / SCR 50AXE / USG Lite 60AX WiFi client devices in the 2.4 / 5 / 6 GHz band. You can click a band to go to the Site-wide > Clients screen and view the client devices that use the respective WiFi band. |
Mobile router / Security router status | This shows the number of Nebula Mobile/Security Routers assigned and connected. |
Collaborative detection & response hit | This shows the total number of malicious traffic detected from wired and WiFi clients that are blocked and quarantined using Collaborative Detection & Response (CDR) in the past 7 days. |
Security router / Firewall / Security Gateway clients by usage | This shows the top five clients of the Nebula Security Appliance with the highest percentage of bandwidth usage in the past 24 hours. |
Security router / Firewall / Security Gateway network applications | This shows the top ten applications used by the Nebula Security Appliance in the past 24 hours. You can click an application to go to the Site-wide > Applications usage screen and view the usage statistics the application used in the site. |
Firewall / Security Gateway status | This shows the number of Nebula Security Appliances assigned and connected, and what percentage of the Security Appliance’s processing capability is currently being used if the CPU goes over 93% usage. |
Security alert | This shows the total number of the latest alerts sent to the administrator in the last 24 hours. |
WAN utilization | This shows the data rate of inbound/outbound traffic in Kbps (kilobits per second) or Mbps (megabits per second) that has been transmitted through the WAN interface. If the Security Appliance supports multiple WAN interfaces and more than one are active, use the arrow to switch and view the throughput of each WAN interface. |
PoE power | This shows the total PoE power budget on the Switch and the current amount of power consumed by the powered devices. |
Switches status | This shows the number of Nebula Switches assigned and connected, and what percentage of the Switches become overloaded, that is, the number of online Nebula Switches that exceed 70% of their upstream bandwidth by total number of online Nebula Switches in the site. |
Port advisor | This shows the total number of times the following abnormalities was detected on the Nebula Switch ports in the past 24 hours. • Storm guard • Cable health • Bandwidth pulse • PoE detection • Loop and BPDU watch |
Access points application usage | This shows the usage statistic of the top ten applications used in the site in the past 24 hours. |
Access points by usage | This shows the top five managed access points with the highest percentage of bandwidth usage in the past 24 hours. This also shows the number of WiFi clients associated with the access points. You can click an access point’s name to go to the Site-wide > Devices > Access Points: Access Points Details screen. |
Access points locations | This shows the locations of access points on the Google map. |
Access points status | This shows the number of assigned and connected Nebula access points, and what percentage of the access points become overloaded, that is, the number of online access points that exceed the maximum client device number (in Site-wide > Configure > Access points > Traffic shaping) by total number of online access points in the site. |
SSIDs by usage | This shows the top five SSIDs with the highest percentage of bandwidth usage in the past 24 hours. You can click a WiFi network name to go to the Site-wide > Monitor > Access Point > Summary report screen. |
Threat protection by CNP services | This shows the total number of times packets coming from an IPv4 address with a bad reputation occur and the number of times connection attempts to an IPv4 address with a bad reputation occur in the past 24 hours. |
WiFi Alert Insight | This shows the following: • Poor health APs: This shows the percentage of supported Nebula Devices that are currently online, that are in poor wireless health threshold as detected by Nebula. Click this to go to Site-wide > Monitor > Access points > Wireless health screen. • Poor health Clients: This shows the percentage of connected WiFi clients that are currently online, and in poor wireless health threshold as detected by Nebula. Click this to go to Site-wide > Monitor > Access points > Wireless health screen. • Failed connection: This shows the percentage of WiFi clients with failed connection attempts (WiFi connection / DHCP failures / DNS failures) to the Nebula Device acting as a hotspot as detected by Nebula. Click this to go to Site-wide > Clients > WiFi Aid screen. |
Security router clients by OS | This shows the top five operating systems used by security router client devices in the past 24 hours. You can click an operating system to go to the Site-wide > Clients screen and view the client devices which use this operating system. |
Threat management | This shows the number of threat management detections and the total volume of network traffic (GB) in the past 24 hours. |
Threat detected by category | This shows the total number of times the category to which the threat belongs was detected in the past 24 hours. |
Threat detected by client | This shows the name of the top five client devices who encountered a threat and the total number of threats detected in the past 24 hours. |