Monitor
Overview
Use the Monitor screens to check status and statistics information.
What You Can Do in this Chapter
Use the Monitor screens for the following.
• Use the Traffic Statistics > Application Usage (The Application Usage Screen) screen to view application statistics.
• Use the Traffic Statistics > Port (The Port Statistics Screen) screen to view the packets statistics for each port selected for monitoring.
• Use the Traffic Statistics > Interface (The Interface Statistics Screen) screen to view the packets statistics for each interface selected for monitoring.
• Use the Traffic Statistics > Session Monitor screen (see The Session Monitor Screen) to view sessions by user or service.
• Use the Security Statistics > Content Filter screen (The Content Filter Screen) to start or stop data collection and view content filter statistics.
• Use the Security Statistics > Reputation Filter screens (The Reputation Filter Screens) to view statistics of IP reputation, DNS threat filtering and URL threat filtering.
• Use the Security Statistics > IPS screen (The IPS Screen) to start or stop data collection and view IPS statistics.
• Use the Security Statistics > Anti-Malware (The Anti-Malware Screen) screen to view anti-malware statistics.
• Use the Security Statistics > SSL Inspection screen (The SSL Inspection Screens) to see a report on SSL Inspection and a certificate cache list.
• Use the Network Status > Interface screen (see The Session Monitor Screen) to view the interface packets statistics.
• Use the Network Status > Device Insight screen (see The Device Insight Screen) to view the status of the clients connected to the Zyxel Device.
• Use the Network Status > Login Users screen (The Login Users Screen) to look at a list of the users currently logged into the Zyxel Device.
• Use the Network Status > DHCP Table screen (see The DHCP Table Screen) to view a list of interfaces and their DHCP-assigned IP addresses.
• Use the VPN Status > IPSec VPN > Site to Site VPN screen (The Site to Site VPN Screen) to display and manage active IPSec Policies.
• Use the VPN Status > IPSec VPN > Remote Access VPN screen (The Remote Access VPN Screen) to display and manage remote access VPN clients.
• Use the VPN Status > SSL VPN > Remote Access VPN screen (The SSL VPN Screen) to list the users currently logged into the SSL VPN client portal. You can also log out individual users and delete related session information.
• Use the VPN Status > Tailscale screen (The Tailscale Screen) to display Tailscale VPN connection information.
The Application Usage Screen
This screen provides a convenient way to monitor the use of various applications by hosts in the network.
If a license has expired, you will see a reminder in this screen. You need to renew the license in order to keep using the feature. Click Buy Now to go to Marketplace to purchase a new license. Click See Details to go to the Zyxel web page to find more information on licenses for your Zyxel Device. 
This screen displays usage by application type or the IP addresses of hosts in your network.
The following table describes the labels in this screen.
label | description |
|---|---|
Last 24 Hours Summary | If you want to view more data than the past 24 hours in SecuReporter, click View More. You should already have a SecuReporter account. |
Pie Chart | Click an item in the pie chart for more detailed information. |
Refresh | Click this button to update the report display. |
Flush Data | Click this button to discard all of the screen’s statistics for inactive sessions. Flushing data only removes traffic logs from ended sessions. Active sessions remain unaffected. Click Refresh to update the report display. |
Top Usage by | Select to display usage by application or host IP address. |
Application | If you selected by application, then this is the name of the application identified. |
Category | This is the category the application belongs to. |
Usage | This is how much traffic the application has used. |
%Usage | This is the percentage of traffic the application has used. |
Client IP address | If you selected by host IP address, then this is the IP address of the host identified. |
Client Description | This is the name of the host identified. |
MAC Address | This is the MAC address of the host device. |
Usage | This is how much traffic the host has used. |
%Usage | This is the percentage of traffic the host has used. |
The Port Statistics Screen
Use this screen to look at packets statistics for each Gigabit Ethernet port. Ports are physical ports to which you connect cables.
The following table describes the labels in this screen.
label | description |
|---|---|
Monitor Port | Select a port from the drop-down list box to view the port packets statistics. |
Poll Interval | Enter how often you want this window to be updated automatically, and click Refresh. |
TX | This line represents traffic transmitted from the Zyxel Device on the selected physical port since it was last connected. Click TX to show or hide the TX line in the chart. |
RX | This line represents the traffic received by the Zyxel Device on the selected physical port since it was last connected. Click RX to show or hide the RX line in the chart. |
The Interface Statistics Screen
Use this screen to look at packets statistics for each interface. Interfaces are used within the system operationally. You use them in configuring various features.
The following table describes the labels in this screen.
label | description |
|---|---|
Monitor Interface | Select an interface from the drop-down list box to view the interface packets statistics. |
Poll Interval | Enter how often you want this window to be updated automatically, and click Refresh. |
TX | This line displays the transmission speed, in bytes per second, on the interface in the one-second interval before the screen updated. |
RX | This line displays the reception speed, in bytes per second, on the interface in the one-second interval before the screen updated. |
The Session Monitor Screen
The Session Monitor screen displays all established sessions that pass through the Zyxel Device for debugging or statistical analysis. It is not possible to manage sessions in this screen. The following information is displayed.
• User who started the session
• Protocol or service port used
• Source address
• Destination address
• Number of bytes received (so far)
• Number of bytes transmitted (so far)
• Duration (so far)
You can look at all established sessions that passed through the Zyxel Device by user, service, source IP address, or destination IP address. You can also filter the information by user, protocol / service or service group, source address, and/or destination address and view it by user.
The following table describes the labels in this screen.
Label | Description |
|---|---|
View | Select how you want the established sessions that passed through the Zyxel Device to be displayed. Choices are: • sessions by user - display all active sessions grouped by user • sessions by services - display all active sessions grouped by service or protocol • sessions by source IP - display all active sessions grouped by source IP address • sessions by source region - display all active sessions grouped by source IP address • sessions by destination IP - display all active sessions grouped by destination IP address • sessions by destination region - display all active sessions grouped by destination IP address • all sessions - filter the active sessions by the User, Service, Source IP, and Destination IP, and display each session individually (sorted by user). |
Clear Session | Select a session, then click this button to remove the selected session. |
Clear All Sessions | Click this button to remove all sessions. |
Refresh | Click this button to update the information on the screen. The screen also refreshes automatically when you open and close the screen. |
Search | Type an item in the search box, then click this to display all sessions in the table below according to the item you typed. |
Clear All | Click this to remove all items found in the search. |
Filter | Click the Filter icon  , click + to display Add Filter, pick a filter, then click Search to display specific sessions according to the filter selected. You may select multiple filters, but just one of each type, configured one at a time. , click + to display Add Filter, pick a filter, then click Search to display specific sessions according to the filter selected. You may select multiple filters, but just one of each type, configured one at a time. |
The User, Service, Source Address, Destination Address, Source Country and Destination Country fields display if you view all sessions. | |
# | This field is the rank of each record. The names are sorted by the name of user in active session. You can use the pull down menu on the right to choose sorting method. |
User | This field displays the user in each active session. If you are looking at the sessions by users (or all sessions) report, click + or - to display or hide details about a user’s sessions. |
Services | This field displays the protocol used in each active session. If you are looking at the sessions by services report, click + or - to display or hide details about a protocol’s sessions. |
Source | This field displays the source IP address and port in each active session. If you are looking at the sessions by source IP report, click + or - to display or hide details about a source IP address’s sessions. |
Destination | This field displays the destination IP address and port in each active session. If you are looking at the sessions by destination IP report, click + or - to display or hide details about a destination IP address’s sessions. |
Rx | This field displays the amount of information received by the source in the active session. |
Tx | This field displays the amount of information transmitted by the source in the active session. |
Duration | This field displays the length of the active session in hours, minutes, seconds format. |
The Content Filter Screen
The Zyxel Device content filtering includes HTTP(S) traffic scan and DNS domain scan. The HTTP(S) traffic scan allows the Zyxel Device to block access to specific websites, by inspecting the URL or Server Name Indication (SNI) that the user’s web browser sends to the web server. The DNS domain scan allows the Zyxel Device to block access to specific websites by inspecting DNS queries made by users on your network. If the website in the DNS query contains prohibited material, then the Zyxel Device replies to the DNS query with a IP address that points to the block page.
If a license has expired, you will see a reminder in this screen. You need to renew the license in order to keep using the feature. Click Buy Now to go to Marketplace to purchase a new license. Click See Details to go to the Zyxel web page to find more information on licenses for your Zyxel Device. 
These screens display some basic statistics on HTTP(S) traffic scan and DNS domain scan.
The following table describes the labels in this screen.
Label | Description |
|---|---|
Last 24 Hours Summary | If you want to view more data than the past 24 hours in SecuReporter, click View More. You should already have a SecuReporter account. |
Pie Chart | Click an item in the pie chart for more detailed information. |
Top entry by | Use this field to have the following (read-only) table display the top content filter log entries by Blocked Category, Blocked Source IP, Blocked URL, Allowed Category, Allowed Source IP, or Allowed URL. This table displays the most common, recent content filter logs. See the log screen for less common content filter logs or use a syslog server to record all content filter logs. Select Blocked Category to list the web site categories the Zyxel Device has blocked. Select Blocked Source IP to list the source IP addresses of the web sites the Zyxel Device has blocked. Select Blocked URL to list the URLs of the web sites the Zyxel Device has blocked. Select Allowed Category to list the web site categories the Zyxel Device has allowed. Select Allowed Source IP to list the source IP addresses of the web sites the Zyxel Device has allowed. Select Allowed URL to list the URLs of the web sites the Zyxel Device has allowed. |
Refresh | Click this button to update the report display. |
Flush Data | Click this button to discard all of the screen’s statistics. Click Refresh to update the report display. |
Time | This column displays the date and time when the users access the URL or FQDN. |
Action | This column displays whether the Zyxel Device blocks or passes the accessed URL or FQDN. |
URL/Domain | This column displays the URL or domain name of the web site accessed. |
Profile | This column displays the content filter profile the website belongs to. |
Category | This column displays the category the accessed web site belongs to. |
Source IP | This column displays the source IP address of the web site the Zyxel Device has checked. |
Destination IP | This column displays the destination IP address at which the traffic of the web site the Zyxel Device has checked is sent. |
The Reputation Filter Screens
These screens display reputation filter statistics.
The Zyxel Device reputation filter includes IP reputation, DNS threat filter and URL threat filter.
If a license has expired, you will see a reminder in this screen. You need to renew the license in order to keep using the feature. Click Buy Now to go to Marketplace to purchase a new license. Click See Details to go to the Zyxel web page to find more information on licenses for your Zyxel Device. 
IP Reputation
This screen displays IP reputation statistics. IP reputation checks the reputation of an IP address from a database.
The following table describes the labels in this screen.
Label | Description |
|---|---|
Last 24 Hours Summary | If you want to view more data than the past 24 hours in SecuReporter, click View More. You should already have a SecuReporter account. |
Pie Chart | Click an item in the pie chart for more detailed information. |
Top Entries By | Use this field to have the following (read-only) table display the top IP reputation log entries by Category, Infected/Victim Host or Malicious IP. This table displays the most common, recent IP reputation logs. See the log screen for less common IP reputation logs or use a syslog server to record all IP reputation logs. Select Category to list the most common categories of packets that the Zyxel Device has detected. Select Infected/Victim Host to list the most common IP addresses of the infected hosts. Select Malicious IP to list the most common IPv4 addresses with bad reputation that have sent packets to the Zyxel Device. |
Refresh | Click this button to update the report display. |
Flush Data | Click this button to discard all of the screen’s statistics. Click Refresh to update the report display. |
IP Reputation Events | |
Time | This field displays the date and time the entry was created. |
+ Allow List | Select an entry and click this to add it to the IP reputation allow list. |
Malicious IP | This field displays the IPv4 address with bad reputation. |
Infected/Victim Host | This field displays the IP address of the infected host. |
Threat Category | This field displays the category of the entry. |
Threat Level | This field displays the threat level of the entry. |
Occurrence | This field displays how many times the Zyxel Device has detected the event described in the entry. |
DNS Threat Filter
This screen displays DNS threat filter statistics. DNS threat filtering inspects DNS queries made by clients on your network and compares the queries against a database of blocked or allowed Fully Qualified Domain Names (FQDNs).
The following table describes the labels in this screen.
Label | Description |
|---|---|
Last 24 Hours Summary | If you want to view more data than the past 24 hours in SecuReporter, click View More. You should already have a SecuReporter account. |
Pie Chart | Click an item in the pie chart for more detailed information. |
Top Entries By | Use this field to have the following (read-only) table display the top DNS threat filter log entries by Category, Source IP or DNS Name. This table displays the most common, recent DNS threat filter logs. See the log screen for less common DNS threat filter logs or use a syslog server to record all DNS threat filter logs. Select Category to list the most common categories of packets that the Zyxel Device has detected. Select Source IP to list the most common source IP addresses of traffic. Select DNS Name to list the most common FQDNs of the infected websites. |
Refresh | Click this button to update the report display. |
Flush Data | Click this button to discard all of the screen’s statistics. Click Refresh to update the report display. |
DNS Threat Filter Events | |
Time | This field displays the date and time the entry was created. |
+ Allow List | Select an entry and click this to add it to the DNS filtering allow list. |
DNS Name | This field displays the FQDN of an infected website. |
Category | This field displays the category of the entry. |
Source IP | This field displays the source IP address of traffic that you want to trace. |
URL Threat Filter
This screen displays URL threat filter statistics. URL threat filtering compares access to specific URLs against a database of blocked or allowed sites.
The following table describes the labels in this screen.
Label | Description |
|---|---|
Last 24 Hours Summary | If you want to view more data than the past 24 hours in SecuReporter, click View More. You should already have a SecuReporter account. |
Pie Chart | Click an item in the pie chart for more detailed information. |
Top Entries By | Use this field to have the following (read-only) table display the top URL threat filter log entries by Category, URL or Source IP. This table displays the most common, recent URL threat filter logs. See the log screen for less common URL threat filter logs or use a syslog server to record all URL threat filter logs. Select Category to list the most common categories of packets that the Zyxel Device has detected. Select URL to list the most common URLs of the infected websites. Select Source IP to list the most common source IP addresses of traffic. |
Refresh | Click this button to update the report display. |
Flush Data | Click this button to discard all of the screen’s statistics. Click Refresh to update the report display. |
URL Threat Filter Events | |
Time | This field displays the date and time the entry was created. |
+ Allow List | Select an entry and click this to add it to the URL Threat filtering allow list. |
URL | This field displays the URL of an infected website. |
Category | This field displays the category of the entry. |
Source IP | This field displays the source IP address of traffic that you want to trace. |
Destination IP | This field displays the destination IP address of traffic. |
The IPS Screen
This screen displays IPS (Intrusion Prevention System) statistics. An IPS system can detect malicious or suspicious packets and respond instantaneously by rejecting or dropping the packets. The Zyxel Device IPS protects your network against network-based intrusions.
If a license has expired, you will see a reminder in this screen. You need to renew the license in order to keep using the feature. Click Buy Now to go to Marketplace to purchase a new license. Click See Details to go to the Zyxel web page to find more information on licenses for your Zyxel Device. 
The following table describes the labels in this screen.
Label | Description |
|---|---|
Last 24 Hours Summary | If you want to view more data than the past 24 hours in SecuReporter, click View More. You should already have a SecuReporter account. |
Pie Chart | Click an item in the pie chart for more detailed information. |
Top Entries By | Use this field to have the following (read-only) table display the top IPS log entries by Signature Name, Source IP or Destination IP. This table displays the most common, recent IPS logs. See the log screen for less common IPS logs or use a syslog server to record all IPS logs. Select Signature Name to list the most common signatures that the Zyxel Device has detected. Select Source IP to list the source IP addresses from which the Zyxel Device has detected the most intrusion attempts. Select Destination IP to list the most common destination IP addresses for intrusion attempts that the Zyxel Device has detected. |
Refresh | Click this button to update the report display. |
Flush Data | Click this button to discard all of the screen’s statistics. Click Refresh to update the report display. |
Time | This column displays the date and time IPS blocked this IP address. |
+ Allow List | Select an entry and click this to add the signature to the IPS allow list. |
Signature ID | This column displays when you display the unique value given to each intrusion detected. |
Signature Name | This column displays the name to identify the type of intrusion pattern. |
Type | This column displays the categories of intrusions. |
Severity | This column displays the level of threat that the intrusions may pose. |
Source IP | This column displays the source IP address of the intrusion attempts. |
Destination IP | This column displays the destination IP address at which intrusion attempts were targeted. |
The Anti-Malware Screen
This screen displays anti-malware statistics.
If a license has expired, you will see a reminder in this screen. You need to renew the license in order to keep using the feature. Click Buy Now to go to Marketplace to purchase a new license. Click See Details to go to the Zyxel web page to find more information on licenses for your Zyxel Device. 
The following table describes the labels in this screen.
Label | Description |
|---|---|
Last 24 Hours Summary | If you want to view more data than the past 24 hours in SecuReporter, click View More. You should already have a SecuReporter account. |
Pie Chart | Click an item in the pie chart for more detailed information. |
Top Entries By | Use this field to have the following (read-only) table display the top anti-malware log entries by Virus Name, Source IP, and Destination IP. This table displays the most common, recent anti-malware logs. See the log screen for less common anti-malware logs or use a syslog server to record all anti-malware logs. Select Virus Name to list the most common viruses that the Zyxel Device has detected. Select Source IP to list the source IP addresses from which the Zyxel Device has detected the most virus-infected files. Select Destination IP to list the most common destination IP addresses for virus-infected files that Zyxel Device has detected. |
Refresh | Click this button to update the report display. |
Flush Data | Click this button to discard all of the screen’s statistics. Click Refresh to update the report display. |
Anti-Malware Statistics Events | |
Time | This field displays the date and time the entry was created. |
+ Allow List | Select an entry and click this to add it to the anti-malware allow list. |
Virus name | This column displays when you display the entries by Virus Name. This displays the name of a detected virus. |
Hash | This column displays a hash value, MD5 (Message Digest 5) of the detected virus file. MD5 is hash algorithms used to authenticate packet data. |
Source IP | This column displays when you display the entries by Source IP. It shows the source IP address of virus-infected files that the Zyxel Device has detected. |
Destination IP | This column displays when you display the entries by Destination IP. It shows the destination IP address of virus-infected files that the Zyxel Device has detected. |
The Sandbox Screen
This screen displays sandbox statistics.
If a license has expired, you will see a reminder in this screen. You need to renew the license in order to keep using the feature. Click Buy Now to go to Marketplace to purchase a new license. Click See Details to go to the Zyxel web page to find more information on licenses for your Zyxel Device. 
The following table describes the labels in this screen.
Label | Description |
|---|---|
Last 24 Hours Summary | If you want to view more data than the past 24 hours in SecuReporter, click View More. You should already have a SecuReporter account. |
Pie Chart | Click an item in the pie chart for more detailed information. |
Top Entries By | Use this field to have the following (read-only) table display the top sandbox log entries by Destination IP, Source IP and Type. This table displays the most common, recent sandbox logs. See the log screen for less common sandbox logs or use a syslog server to record all sandbox logs. Select Source IP to list the source IP addresses from which the Zyxel Device has detected the most files with unknown or untrusted programs and codes. Select Destination IP to list the most common destination IP addresses for files with unknown or untrusted programs and codes that Zyxel Device has detected. Select Type to display if the file type of the detected file with unknown or untrusted programs and codes. |
Refresh | Click this button to update the report display. |
Flush Data | Click this button to discard all of the screen’s statistics. Click Refresh to update the report display. When the statistics stored reach the limit, new statistics automatically overwrite existing statistics, starting with the oldest statistics first. |
Sandbox Events | |
Time | This field displays the time the file is scanned by the Zyxel Device. |
Type | This field displays the file type of the detected file with unknown or untrusted programs and codes. |
File Name | This column displays the file name of the detected virus file. |
Hash | This column displays a hash value, MD5 (Message Digest 5, of the detected file with unknown or untrusted programs and codes. MD5 is a hash algorithm used to authenticate packet data. |
Source IP | This column displays the source IP address of the file the Zyxel Device has checked. |
Destination IP | This column displays the destination IP address at which the traffic of the file the Zyxel Device has checked is sent. |
The SSL Inspection Screens
The Zyxel Device uses SSL Inspection to decrypt SSL traffic, then sends it to Security Service engines for inspection, and then finally encrypts traffic that passes inspection and forwards it.
The Summary Screen
This screen shows the number of SSL sessions inspected, blocked and passed.
The following table describes the labels in this screen.
Label | Description |
|---|---|
General Settings | |
Refresh | Click this button to update the report display. |
Flush Data | Click this button to discard all of the screen’s statistics. Click Refresh to update the report display. |
Status | |
Maximum Concurrent Sessions | This shows the maximum number of simultaneous SSL Inspection sessions allowed for your Zyxel Device model. |
Concurrent Sessions | This shows the actual number of simultaneous SSL Inspection sessions in progress. |
Summary | |
Total | This is the total of SSL sessions inspected and number of sessions blocked and number of sessions passed since data was last flushed or the Zyxel Device last rebooted after Collect Statistics was enabled. |
Inspected | This shows the total number of SSL sessions inspected since data was last flushed or the Zyxel Device last rebooted after Collect Statistics was enabled |
Decrypted (Kbytes) | This shows the number of kilobytes (KB) of data that was decrypted for Security Service inspection. |
Encrypted (Kbytes) | This shows the number of kilobytes (KB) of data that was re-encrypted after Security Service inspection and then forwarded. |
Blocked | This shows the number of SSL sessions blocked. |
Passed | This shows the number of SSL sessions passed. |
The Certificate Cache List Screen
A certificate identifies the source of SSL traffic. Use this screen to decide which sources can be excluded from SSL inspection. Traffic in an Exclude List is not intercepted by SSL inspection.
The following table describes the labels in this screen.
Label | Description |
|---|---|
Time | This is the latest date (yyyy-mm-dd) and time (hh-mm-ss) that the record in the certificate cache list was met. |
Add to Exclude list | Select and item in the list and click this icon to add the common name (CN) to the Exclude List. |
Common Name | This displays the common name in the certificate of the SSL traffic destination server. |
Server Name Indication | Server Name Indication (SNI) is the domain name entered in the browser, FTP client, etc. to begin the SSL session with the server. It allows multiple SSL sessions to the same IP address and port number with different certificates from different SNI. This field displays the SNI for this SSL session. |
SSL Version | This field shows the SSL version. TLS1.0/1.1/1.2 are currently supported. |
Destination | This displays the IP address and port number of the SSL traffic destination server. |
Valid Time | This displays the cache item expiry time in seconds. The cache item is deleted when the remaining time expires. |
The Interface Screen
This screen lists all of the Zyxel Device’s interfaces and their information.
The following table describes the labels in this screen.
Label | Description |
|---|---|
Refresh | Click this to update the information in this screen. |
Name | This field displays the name of each interface. |
Members | This field displays the physical port number that is binded to the interface. An interface is binded to a port when the interface is bounded to the physical port. When you create a bridge interface, the Zyxel Device removes the members' entries from the routing table and adds the bridge interface's entries to the routing table. This field displays the bridge interface's members. |
Type | This field displays the type of connection the interface is using. |
Status | This field displays the current status of each interface. The possible values depend on what type of interface it is. For Ethernet interfaces: • Inactive - The Ethernet interface is disabled. • Down - The Ethernet interface does not have any physical ports associated with it or the Ethernet interface is enabled but not connected. • Speed / Duplex - The Ethernet interface is enabled and connected. This field displays the port speed and duplex setting (Full or Half). For the auxiliary interface: • Inactive - The auxiliary interface is disabled. • Connected - The auxiliary interface is enabled and connected. • Disconnected - The auxiliary interface is not connected. For virtual interfaces, this field always displays Up. If the virtual interface is disabled, it does not appear in the list. For VLAN and bridge interfaces, this field always displays Up. If the VLAN or bridge interface is disabled, it does not appear in the list. For PPP interfaces: • Connected - The PPP interface is connected. • Disconnected - The PPP interface is not connected. If the PPP interface is disabled, it does not appear in the list. |
Zone | This field displays the zone to which the interface is assigned. |
IP Addr/Netmask | This field displays the current IP address and subnet mask assigned to the interface. If the IP address and subnet mask are 0.0.0.0, the interface is disabled or did not receive an IP address and subnet mask via DHCP. If this interface is a member of an active virtual router, this field displays the IP address it is currently using. This is either the static IP address of the interface (if it is the master) or the management IP address (if it is a backup). |
VLAN ID | This field displays the VLAN ID which is a 12-bit number that uniquely identifies each VLAN. |
IP Assignment | This field displays how the interface gets its IP address. • Static - This interface has a static IP address. • DHCP Client - This interface gets its IP address from a DHCP server. |
Service | This field lists which services the interface provides to the network. Examples include DHCP relay, DHCP server and DDNS. This field displays n/a if the interface does not provide any services to the network. |
Action | Use this field to get or to update the IP address for the interface. Click Renew to send a new DHCP request to a DHCP server. |
VPN Rule | This field displays the scenario rule the VPN tunnel interface is using. |
The Device Insight Screen
Use Device Insight to collect status and basic information of the clients connected to the Zyxel Device internal interfaces or IPSec VPN or Astra clients with or without VPN Zyxel Client software installed. The clients shown may include clients connected to the Zyxel Device:
• Using wired connections.
• Through access points (APs) using wired connections.
• Through access points (APs) using WiFi connections.
• Through built-in access points using WiFi connections.
• Using SecuExtender (IPSec VPN clients).
Device Insight collects client information including:
• Hostname
• IP address and MAC address
• Operating system
• Category, such as mobile phones or computers
• Connected interface
If a license has expired, you will see a reminder in this screen. You need to renew the license in order to keep using the feature. Click Buy Now to go to Marketplace to purchase a new license. Click See Details to go to the Zyxel web page to find more information on licenses for your Zyxel Device. 
The following table describes the labels in this screen.
label | description |
|---|---|
Edit | Double-click an entry or select it and click Edit to modify the entry’s settings in the Description field. |
Remove | Select an entry and click Remove to remove a client from the table that’s no longer connected to your network. For example, guest A visited your company over a month ago. Guest A used his cellphone to connect to your Zyxel Device networks. His cellphone was identified and shown in the Device Insight table. Guest A has left for over a month and you’re sure he will not return in the near future. You can use the Remove button to remove his device from this table. Guest A’s device will be identified and shown in the table again if he connects to your Zyxel Device networks in the future. Please note that clients that are blocked cannot be removed. Make sure to unblock clients before you remove them. |
Add to block list | Select an entry and click Add to block list to stop the selected client from connecting to the Zyxel Device. |
Remove from block list | Select an entry and click Remove from block list to allow the selected client to connect to the Zyxel Device. |
Feedback | Select an entry and click Feedback to report on a client that is wrongly identified regarding its Category, Operating System or Type. |
Status | This field displays the status of the clients. Online (  )- The connection between the client and the Zyxel Device is up. )- The connection between the client and the Zyxel Device is up.Offline (  )- The connection between the client and the Zyxel Device is down. )- The connection between the client and the Zyxel Device is down.Block (  )- The client is blocked from the connection to the Zyxel Device. )- The client is blocked from the connection to the Zyxel Device. |
MAC Address | This field displays the MAC address of the client. |
MAC Vendor | This displays the MAC address Organizationally Unique Identifier (OUI). The OUI is the first three octets in a MAC address and uniquely identifies the manufacturer of a network device. |
IP Address | This field displays the IP address of the client. |
Hostname | This field displays the name used to identify this device on the network. |
Description | This field displays the descriptive name of the client. |
Connected to | This field displays the interface to which a client is connected directly to on the Zyxel Device. |
Connected to | This field displays the interface to which a client is connected directly to on the Zyxel Device. |
Operating System (OS) | This field displays the operating system of the client. |
OS Version | This field displays the version of the operating system of the client. |
Type | This field displays the model names of the client. |
First-seen | This field displays the time when the client first sends traffic to the Zyxel Device since the Zyxel Device last reboot. |
Last-seen | This field displays the time when the client last sends traffic to the Zyxel Device. |
User | This field displays the type of user account the client uses. See What You Need To Know for more information the user account types. |
Auth method | This field displays the authentication method that is used to authenticate the client. |
Astra Group & Role | This field displays the group name and role (admin or member) of the client on Astra. • admin: The Astra web portal is a platform that provides security services to computer or mobile devices. It is managed by an admin. • member: A member is a person whose computer or mobile device the admin wishes to protect using Astra. You can add your mobile device or a member’s mobile device using this Astra web portal account. |
Astra Agent Version | This field displays the version of Astra. |
Client Firewall Status | This field displays the firewall status on the client’s computer or mobile device, such as a smartphone. The field is blank is if there is no firewall on the client. • Enabled: The firewall is enabled on the client. • Disabled: The firewall is disabled on the client. |
Astra License Status | This field displays the current Astra license status of the client. The following displays for a license you subscribed to from the Astra Portal. • Activated: The Astra license is enabled. • Inactive: The Astra license is not enabled. • Overdue: The payment for the Astra license has failed, and the license will be canceled 15 days after the overdue date. During this period, attempts will be made to process the credit card payment. • Cancel: The Astra license will be canceled after the expiration date. • None: A standard or trial license has not been enabled. The following displays for a license you purchased offline. You’ll need to use the license key to activate the license online. • Activated: The Astra license is enabled. • Grace period: After a license expires, you have 15 days grace period during which you can extend your current license. • Expired: The Astra license has expired. • None: A standard or trial license has not been enabled. |
The Login Users Screen
Use this screen to see a list of users currently logged into the Zyxel Device.The following table describes the labels in this screen.
Label | Description |
|---|---|
Force Logout | Select a user row and click this icon to end a user’s session. |
# | This field is a sequential value and is not associated with any entry. |
User ID | This field displays the user name of each user who is currently logged in to the Zyxel Device. |
Role | This field displays the types of user accounts the Zyxel Device uses. See User/Group User Summary Screen for more information on the user accounts. |
From | This field displays the IP address of the computer used to log in to the Zyxel Device. |
Login Time | This field displays how long a user account has logged into the Zyxel Device. |
Type | This field displays the way the user logged into the Zyxel Device. The user can log into the Zyxel Device using HTTP, HTTPS, SSH, FTP and console. |
Tunnel IP | This field displays the IP address of the VPN tunnel a user account is using to access the Zyxel Device. This field displays 0.0.0.0 if a user account is not accessing the Zyxel Device through a VPN tunnel. |
Reauth/Lease Time | This field displays the amount of reauthentication time remaining and the amount of lease time remaining for each user. See User Add/Edit Screen for more information on the reauthentication time and lease time. |
The Lockout IPs Screen
Use this screen to view and unlock IP addresses blocked from logging in to the Zyxel Device. If a user exceeds the limit on the number of unsuccessful login attempts (for example, wrong password), the Zyxel Device will lock the IP address for a specified amount of time. Go to User & Authentication > User/Group > Setting to configure these user account lockout settings. See User/Group Setting Screen for more information.
The following table describes the labels in this screen.
Label | Description |
|---|---|
Unlock | Select an IP address and click Unlock to allow the user from that IP address to log into the Zyxel Device. |
# | This field is a sequential value and is associated with the lockout IP address entries. |
IP | This displays the IP address that exceeded the login attempt limit. |
Last User ID | This displays the user name of the user who exceeded the login attempt limit. |
Role | This displays the type of user account that attempted to log into the Zyxel Device. • Admin: This user can configure the Zyxel Device settings using the web configurator or CLI. • Viewer: This user can only view the Zyxel Device settings using the web configurator and perform basic diagnostics for troubleshooting using the command line interface (CLI). • User: This user has access to the Zyxel Device’s services, such as VPN, and can also browse. This user cannot configure or view the Zyxel Device settings using the web configurator or CLI. • External User: This user account is maintained on a remote server, such as RADIUS or LDAP. This user has access to the Zyxel Device’s services, such as VPN, and can also browse but cannot configure or view the Zyxel Device settings using the web configurator or CLI. |
Lockout Time | This displays how long the IP address has been blocked by the Zyxel Device. |
The DHCP Table Screen
Use this screen to look at a list of interfaces and their DHCP-assigned IP addresses.
The following table describes the labels in this screen.
Label | Description |
|---|---|
Current DHCP List | |
Interface | Select a Zyxel Device interface that has DHCP enabled to show to which devices it has assigned DHCP IP addresses. |
Add | Click this to add an entry that maps a static IP to a MAC address. |
Release | Select an entry and click on this button to let other devices use the dynamic DHCP that is currently assigned to the selected entry. |
Reserved | Select an entry and click on this button to make the entry a static DHCP entry, meaning the DHCP client is always assigned the same IP address from the DHCP server. |
Unreserve | Select an entry and click on this button to change the entry from a static DHCP entry to a dynamic DHCP entry, meaning the DHCP client may get a different IP address from the DHCP server when the IP address is renewed. |
Export | Click this button to download all entries in the DHCP table to your computer in csv format with file name containing the current date. |
Refresh | Click this button to update the mapping between IP addresses and MAC addresses. |
Column header | Click a column’s heading cell to sort the table entries by the column entry. Click the heading cell again to reverse the sort order. |
Interface | This field identifies the interface that assigned an IP address to a DHCP client. |
IP Address | This field displays the IP address currently assigned to a DHCP client or reserved for a specific MAC address. Click the column’s heading cell to sort the table entries by IP address. Click the heading cell again to reverse the sort order. |
Host Name | This field displays the name used to identify this device on the network (the computer name). The Zyxel Device learns these from the DHCP client requests. None shows here for a static DHCP entry. A host name cannot exceed 255 characters. Valid characters are [0-9][a-z][A-Z][-]. |
MAC Address | This field displays the MAC address to which the IP address is currently assigned or for which the IP address is reserved. The MAC address format can be "xx:xx:xx:xx:xx:xx" or "xx-xx-xx-xx-xx-xx" |
VLAN ID | This field displays the VLAN to which the IP address belongs, if any. |
Expire Time | This displays the date and time the DHCP-assigned address will be renewed. |
Description | This field displays a description of the DHCP client to identify it. The description cannot exceed 64 characters. Valid characters are [0-9][a-z][A-Z][_ -]. |
Status | This field displays the connection status of the DHCP client. Reserved means a static DHCP entry. - means a dynamic DHCP entry. |
The IPSec VPN Screen
Click a column’s heading cell to sort the table entries by that column’s criteria. Click the heading cell again to reverse the sort order.
The Site to Site VPN Screen
Use this screen to display and to manage active IPSec policies.
Each field is described in the following table.
Label | Description |
|---|---|
Disconnect | Select an IPSec policy and click this button to disconnect it. |
Refresh | Select an IPSec policy and click this button to update its status. |
Connectivity Check | Select an IPSec policy and click this button to check the connection to a remote client through this VPN tunnel. Enter an IP address in the remote policy subnet range. The Zyxel Device interface must comply with the local policy subnet range. The check will time out after 5 seconds if there is no reply to the ICMP check (Ping). 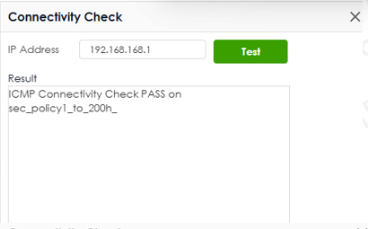 |
# | This field is a sequential value, and it is not associated with a specific SA. |
Name | This field only displays the client names if they’re using EAP or X-auth for authentication. If a client is connected to the Zyxel Device without using Extended Authentication Protocol (EAP) or X-Auth, this field will be empty. |
Remote Gateway | This field displays the IP address of the remote gateway. |
Remote ID | This field displays the ID of the remote gateway. |
My Address | This field displays the IP address of the Zyxel Device. |
Policy Route | This field displays the content of the local and remote policies for this IPSec policy. The IP addresses, not the address objects, are displayed. |
Uptime | This field displays how many seconds the IPSec policy has been active. This field displays N/A if the IPSec policy uses manual keys. |
Rekey | This field displays how many seconds remain in the SA life time, before the Zyxel Device automatically disconnects the IPSec policy. This field displays N/A if the IPSec policy uses manual keys. |
Inbound (Bytes) | This field displays the amount of traffic that has gone through the IPSec policy from the remote IPSec router to the Zyxel Device since the IPSec policy was established. |
Outbound (Bytes) | This field displays the amount of traffic that has gone through the IPSec policy from the Zyxel Device to the remote IPSec router since the IPSec policy was established. |
The Remote Access VPN Screen
Use this screen to display or disconnect remote access VPN clients that are connected to the Zyxel Device. The remote access VPN clients must have SecuExtender or use supported computer or mobile operating systems; see The Remote Access VPN Screen for more information.
Each field is described in the following table.
Label | Description |
|---|---|
Disconnect | Select a remote access VPN client and click this button to disconnect it. |
Refresh | Click Refresh to update this screen. |
# | This field is a sequential value, and it is not associated with a specific remote access VPN client. |
Username | This field displays the name of the remote access VPN client. |
Assigned IP | This field displays the IP address the user used to establish this remote access VPN connection. |
Remote IP | This field displays the IP address of the remote IPSec router the remote access VPN client is connected to. |
Up Time | This field displays how many seconds the remote access VPN client has been active. This field displays N/A if the remote access VPN client uses manual keys. |
Reauth/Lease Time | This field displays the amount of reauthentication time remaining and the amount of lease time remaining for each remote access VPN client. |
Inbound (Bytes) | This field displays the number of bytes received by the Zyxel Device on this connection. |
Outbound (Bytes) | This field displays the number of bytes transmitted by the Zyxel Device on this connection. |
The SSL VPN Screen
The Zyxel Device keeps track of the SSL VPN clients who are currently logged into the Zyxel Device. Use this screen to:
• View a list of active SSL VPN connections.
• Log out individual users and delete related session information.
Once a user logs out, the corresponding entry is removed from the screen.
The SSL VPN clients must have SecuExtender or use supported computer or mobile operating systems; see The SSL VPN Screen for more information.
The following table describes the labels in this screen.
label | description |
|---|---|
Disconnect | Select a connection and click this button to terminate the user’s connection and delete corresponding session information from the Zyxel Device. |
Refresh | Click Refresh to update this screen. |
# | This field is a sequential value, and it is not associated with a specific SSL. |
Username | This field displays the account user name used to establish this SSL VPN connection. |
Assigned IP | This field displays the IP address the user used to establish this SSL VPN connection. |
Remote IP | This field displays the remote SSL VPN router the SSL VPN is connected to. |
Up Time | This field displays how many seconds the SSL VPN client has been active. This field displays N/A if the SSL VPN client uses manual keys. |
Reauth/Lease Time | This field displays the amount of reauthentication time remaining and the amount of lease time remaining for each SSL VPN client. |
Inbound (Bytes) | This field displays the number of bytes received by the Zyxel Device on this connection. |
Outbound (Bytes) | This field displays the number of bytes transmitted by the Zyxel Device on this connection. |
Regular Expressions in Searching IPSec Policies
A question mark (?) lets a single character in the VPN connection or policy name vary. For example, use “a?c” (without the quotation marks) to specify abc, acc and so on.
Wildcards (*) let multiple VPN connection or policy names match the pattern. For example, use “*abc” (without the quotation marks) to specify any VPN connection or policy name that ends with “abc”. A VPN connection named “testabc” would match. There could be any number (of any type) of characters in front of the “abc” at the end and the VPN connection or policy name would still match. A VPN connection or policy name named “testacc” for example would not match.
A * in the middle of a VPN connection or policy name has the Zyxel Device check the beginning and end and ignore the middle. For example, with “abc*123”, any VPN connection or policy name starting with “abc” and ending in “123” matches, no matter how many characters are in between.
The whole VPN connection or policy name has to match if you do not use a question mark or asterisk.
The Tailscale Screen
The Zyxel Device supports Tailscale, a mesh VPN (Virtual Private Network) service that connects client devices (such as computers, smartphones, routers, and firewalls) across different networks. Use this screen to view the Tailscale connection status.
Click VPN Status > Tailscale to display the following screen.
The following table describes the labels in this screen.
label | description |
|---|---|
Refresh | Click Refresh to update this screen. |
# | This field is a sequential value, and it is not associated with a specific VPN connection. |
Machine Name | This field displays the domain name of the Tailscale server. |
Tailscale IP | This field displays the IP address assigned to the Zyxel Device by the Tailscale server. |
Owner | The Tailscale account name that establishes the VPN connection. |
Status | This displays the status of the VPN connection. • active: The VPN connection is established and data is being transmitted. • idle: The VPN connection is established and ready to be used, but no data is being transmitted. • offline: The Zyxel Device is currently not connected to the Tailscale network. • -: No data has ever been sent to or received from the Zyxel Device. |
Inbound (Bytes) | This field displays the number of bytes received by the Zyxel Device on this VPN connection. |
Outbound (Bytes) | This field displays the number of bytes transmitted by the Zyxel Device on this VPN connection. |